A word of caution here: This is very impressive, but almost entirely wrong for your organisation.
Most log messages are useless 99.99% of the time. Best likely outcome is that its turned into a metric. The once in the blue moon outcome is that it tells you what went wrong when something crashed.
Before you get to shipping _petabytes_ of logs, you really need to start thinking in metrics. Yes, you should log errors, you should also make sure they are stored centrally and are searchable.
But logs shouldn't be your primary source of data, metrics should be.
things like connection time, upstream service count, memory usage, transactions a second, failed transactions, upsteam/downstream end point health should all be metrics emitted by your app(or hosting layer), directly. Don't try and derive it from structured logs. Its fragile, slow and fucking expensive.
comparing, cutting and slicing metrics across processes or even services is simple, with logs its not.
Metrics are only good when you can disregard some amount of errors without investigation. But they're a financial organization, they have a certain amount of liability. Generalized metrics won't help to understand what happened to that one particular transaction that failed in a cumbersome way and caused some money to disappear.
You can still have logs. What I'm suggesting is that vast amounts of unstructured logs, are worse than useless.
Metics tell you where and when something when wrong. Logs tell you why.
However, a logging framework, which is generally lossy, and has the lowest level of priority in terms of deliverability is not an audit mechanism. especially as nowhere are ACLs or verifiability is mentioned. How do they prove that those logs originates from that machine?
If you're going to have an audit mechanism, some generic logging framework is almost certainly a bad fit.
> You can still have logs. What I'm suggesting is that vast amounts of unstructured logs, are worse than useless
Until you need them, the you'd trade anything to get them. Logs are like backups, you don't need them most of the times, but when you need them, you really need them.
On the flip side, the tendency is to over-log "just in case". A good compromise is to allocate a per-project storage budget for logs with log expiration, and let the ones close to the coal-face figure out how they use their allocation.
Even at very immature organizations, log data within a service is usually structured.
Even in my personal projects if I'm doing anything parallel structured logging is the first helper function I write. I don't think I'm unrepresentative here.
> Even at very immature organizations, log data within a service is usually structured.
unless the framework provides it by default, I've never seen this actually happen in real life. Sure I've seen a lot of custom telegraf configs, status end points and the like, but never actual working structured logging.
When I have seen structure logs, each team did it differently, The "ontology" was different (protip: if you're ever discussing ontology in logging then you might as well scream and run away.)
I suspect you and the parent are using different meanings of the word "structured". They're not totally random or they wouldn't be usable. It's a question of what the structuring principle is.
Am I crazy here? We run all of our app logs and error logs through LogStash and just have a few filters in there to normalize stuff like the timestamp. Honestly the only peace of data that absolutely HAS to be standardized because that’s the piece of data that splits our log indexes, is the primary sorting mechanism, and at what point we roll up an index into some aggregates and then compress and send it to cold storage.
> "But they're a financial organization, they have a certain amount of liability."
In the loosest possible sense. Binance is an organization that pretended it doesn't have any physical location in any jurisdiction. Its founder is currently in jail in the United States.
It's always struck me that these are two wildly different concerns though.
Use metrics & SLOs to help diagnose the health of your systems. Derive those directly from logs/traces, keep a sample of the raw data, and now you can point any alert to the sampled data to help go about understanding a client-facing issue.
But, for auditing of a particular transaction, you don't need full indexing of the events? You need a transactional journal for every account/user, likely with a well-defined schema to describe successful changes and failed attempts. Perhaps these come from the same stream of data as the observability tooling, but I can only imagine it must be a much smaller subset of the 100PB that you can avoid doing full inverse indexes on this, because your search pattern is simply answering "what happened to this transaction?"
The reality is that when their service delays something they owe us tens to hundreds of thousands of dollars. This is the tool they’re using but if they can’t even get a precise notion of when a specific request arrived at their gateway they’re in trouble.
As an engineer I generally want logs so I can dive into problems that weren't anticipated. Debugging.
I get a lot of pushback from ops folks. They often don't have the same use case. The logs are for the things that'll be escalated beyond the ops folks to the people that wrote the bug.
Yes, most (> 99.99%) of them will never be looked at. But storage is supposed to be cheap, right? If we can waste bytes on loading a copy of Chromium for each desktop application, surely we can waste bytes on this.
My argument is completely orthogonal to "do we want to generate metrics from structured logs".
Most probably, said ops folks have quite a few war stories to share about logs.
Maybe a JVM-based app went haywire, producing 500GB of logs within 15 minutes, filling the disk, and breaking a critical system because no one anticipated that a disk could go from 75% free to 0% free in 15 minutes.
Maybe another JVM-based app went haywire inside a managed Kubernetes service, producing 4 terabytes of logs, and the company's Google Cloud monthly usage went from $5,000 to $15,000 because storing bytes is supposed to be cheap when they are bytes and not when they are terabytes.
I completely agree that logs are useful, but developers often do not consider what to log and when.
Check your company's cloud costs. I bet you the cost of keeping logs is at least 10%, maybe closer to 25% of the total cost.
Agreed you need to engineer the logging system and not just pray. "The log service slowed down and our writes to it are synchronous" is one I've seen a few times.
On "do not consider what to log and when" .. I'm not saying don't think about it at all, but if I could anticipate bugs well enough to know exactly what I'll need to debug them, I'd just not write the bug.
Just saw this at work recently - 94% of log disk space for domain controllers were filled by logging what groups users were in (I don't know the specifics but group membership is pretty static, and if a log-on fails I assume the missing group is logged as part of that failure message).
Sounds like really bad design choices here. #1 logs shouldn't go on the same machine that's running the app, they should be reported tp another server and if you want local logs, then properly setup log rotators. Both would be good.
Something I’ve discovered is that Azure App Insights can capture memory snapshots when an exception happens. You can download these with a button press and open in Visual Studio with a double-click.
It’s magic!
The stack variables, other threads and most of the heap is right there as-if you had set a breakpoint and it was an interactive debug session.
IMHO this eliminates the need for 99% of the typical detailed tracing seen in large complex apps.
I simply doubt that most of these logs (or anyone’s, usually) are that useful.
I worked at a SaaS observability company (Datadog competitor) that was ingesting, IIRC, multiple GBps of metrics, spread across multiple regions, dozens upon dozens of cells, etc. Our log budget was 650 GB/day.
I have seen – entirely too many times – DEBUG logs running in prod endlessly, messages that are clearly INFO at best classified as ERROR, etc. Not to mention where a 3rd party library is spamming the same line continuously, and no one bothers to track down why and stop it.
You probably don't need full text search, but only exact match search and very efficient time-based retrieval of contiguous log fragments. As an engineer spending quite a lot of time debugging and reading logs, our Opensearch has been almost useless for me (and a nightmare for our ops folks), since it can miss searches on terms like filenames and OSD UX is slow and generally unpleasant. I'd rather have a 100MB of text logs downloaded locally.
Please enlighten me, what are use cases for real full-text search (with fuzzy matching, linguistic normalization etc.) in logs and similar machine-generated transactional data? I understand its use for dealing with human-written texts, but these are rarely in TB range, unless you are indexing the Web or logs of some large-scale communication platform.
I agree that fuzzy matching etc. are usually not needed, but in my experience I need at least substring match. A log message may say "XYZ failed for FOO id 1234556789" and I want to be able to search logs for 123456789 to see all related information (+ trace id if available)
In systems that deal with asynchronous actions, log entries relating to "123456789" may be spread over minutes, hours or even days. When researching issues, I have found searches like Opensearch, Splunk etc. invaluable and think the additional cost is worth it. But we also don't have PB of logs to handle, so there may be a point where the cost is greater than the benefit.
My response to that would be that you can enable logging locally, or in your staging environment, but not in production. If an error occurs, your telemetry tooling should gather a stack trace and all related metadata, so you should be able to reproduce or at least locate the error.
But all other logs produced at runtime are breadcrumbs that are only ever useful when an exception occurs, anyway. Thus, you don’t need them otherwise.
Storage is not cheap at this scale. That would be 100s of thousands a year at the very least. (How I know, I work in an identical area and have huge budget problems with rando verbose logging).
My system has a version number and input + known starting state dbwise. Now assuming i have determenistic reprodible state, is a log just a replay of that game engine at work?
Interesting you should mention inputs. One of the things I’ve often found useful to log are the data that are inputs into a decision the code is going to make. This can be difficult to reconstruct after the fact, especially if there is a cache between my code and the source of truth.
> Most log messages are useless 99.99% of the time. Best likely outcome is that its turned into a metric. The once in the blue moon outcome is that it tells you what went wrong when something crashed.
If it crashes, it's probably some scenario that was not properly handled. If it's not properly handled, it's also likely not properly logged. That's why you need verbose logs -- once in a blue moon you need to have the ability to retrospectively investigate something in the past that was not thought through, without using a time machine.
This is more common in the financial world where audit trail is required to be kept long term for regulation. Some auditor may ask you for proof that you have done a unit test for a function 3 years ago.
Every organization needs to find their balance between storage cost and quality of observability. I prefer to keep as much data as we are financially allowed. If Binance is happy to pay to store 100PB logs, good for them!
"Do we absolutely need this data or not" is a very tough question. Instead, I usually ask "how long do we need to keep this data" and apply proper retention policy. That's a much easier question to answer for everyone.
It is quite unlikely that a regulator will ask you for proof you have a unit test for anything (also, that's not what a unit test is - see [1] for a good summary of why).
It _is_ likely a regulator will ask you to prove that you are developing within the quality assurance framework you have claimed you are, though.
Finally though, logs are not an audit trail, and almost no-one can prove their logs are correct with respect to the state of the system at any given time.
> If it's not properly handled, it's also likely not properly logged
Then you're blue moon probability if it being useful rapidly drops. Verbose logs are simply a pain in the arse, unless you have a massive processing system. but even then it just either kneecaps your observation window, or makes your queries take ages.
I am lucky enough to work at a place that has really ace logging capability, but, and I cannot stress this enough, it is colossally expensive. literal billions.
but, logging is not an audit trail. Even here where we have fancy PII shields and stuff, logging doesn't have the SLA to record anything critical. If there is a capacity crunch, logging resolution gets turned down. Plus logging anything of value to the system gets you a significant bollocking.
If you need something that you can hand to a government investigator, if you're pulling logs, you're already in deep shit. An audit framework needs to have a super high SLA, incredible durability and strong authentication for both people and services. All three of those things are generally foreign to logging systems.
Logging is useful, you should log things, but, you should not use it as a way to generate metrics. verbose logs are just a really efficient way to burn through your infrastructure budget.
> Verbose logs are simply a pain in the arse, unless you have a massive processing system. but even then it just either kneecaps your observation window, or makes your queries take ages.
which is why this blog post brags about their capability. Technologies advances, and something difficult to do today may not be as difficult tomorrow. If your logging infra is overwhelmed, by all means drop some data and protect the system. But if Binance is happily storing and querying their 100PB logs now, that's their choice and it's totally fine. I won't say they are doing anything wrong. Again, we are talking about blue moon scenarios here, which is all about hedging risks and uncertainties. It's fine if Netflix drops a few frames of pictures in a movie, but my bank can't drop my transaction.
I think this works well if you think about sampling traces not logs.
Basically, every log message should be attached to a trace. Then, you might choose to throw away the trace data based on criteria, e.g. throw away 98% of "successful" traces, and 0% of "error" traces.
The (admittedly not particularly hard) challenge then is building the infra that knows how to essentially make one buffer per trace, and keep/discard collections of related logs as required.
It sounds nice, but also consider: 1) depending on how your app crashes, are you sure the buffer will be flushed, and 2) if logging is expensive from a performance perspective, your base performance profile may be operating under the assumption that you’re humming along not logging anything. Some errors may beget more errors and have a snowball effect.
Both solved by having a sidecar (think of as a local ingestion point) that records everything (no waiting for flush on error), and then does tail sampling on the spans where status is non OK - i.e. everything thats non OK gets sent to Datadog, Baselime, your Grafana setup, your custom Clickhouse 100PB storage nodes. Or take your pick of any of 1000+ OpenTelemetry compatible providers. https://opentelemetry.io/docs/concepts/sampling/#tail-sampli...
Hogwash. I’ll agree that it’s not as simple with logs, but amazingly powerful, and even more so with distributed tracing.
They both have their places and are both needed.
Without logs, I would not have been able to pinpoint multiple issues that plagued our systems. With logs, we were able to tell google, Apigee, it was there problem, not ours. With tracing, we were able to tell a legacy team they had an issue and was able to pinpoint it after them telling us for 6 months that it was our fault. Without logging and tracing, we wouldn’t have been able to tell our largest client, that we never received a 1/3 of their requests they sent us as our company was running around frantically.
They’re both needed, but for different things…ish.
You're missing my main point: logs should not be your primary source of information.
> Without logs, I would not have been able to pinpoint multiple issues that plagued our systems.
Logs are great for finding out what went wrong, but terrible at telling there is a problem. This is what I mean by primary information source. If you are sifting through TBs logs to pinpoint a issue, it sucks. Yes, there are tools, but its still hard.
Logs are shit for deriving metrics, it usually requires some level of bespoke processing which is easy to break silently, especially for rarer messages.
> You're missing my main point: logs should not be your primary source of information.
I think you're missing my point. They're both needed. Metrics are outside blackbox and logs are inside -- they're both needed. I don't recall saying that logs should be the primary source.
> Logs are shit for deriving metrics, it usually requires some level of bespoke processing which is easy to break silently, especially for rarer messages.
Truthfully, you're probably just doing it wrong if you can't derive actionable metrics from logs / tracing. I'm willing to hear you out though. Are you using structured logs? if so, please tell me more how you're having issues deriving metrics from those. if not, that's your first problem.
> logs are great for finding out what went wrong, but terrible at telling there is a problem
> Truthfully, you're probably just doing it wrong if you can't derive actionable metrics from logs
I have ~200 services, each composed of many sub services, each made up of a number of processes. something like 150k processes.
Now, we are going to ship all those logs, where every transaction emits something like 500-2000 bytes of data. Storing that is easy, evne storing it in a structured way is easy. making sure we don'y leak PII is a lot harder, so we have to have fairly strict ACLs.
now, I want process them to generate metrics and then display them. But that takes a lot of horse power. Moreover when I want to have metrics for more than a week or so, the amount of data I have to process grows linearly. I also need to back up that data, and derived metrics. We are looking at a large cluster just for processing.
Now, if we make sure that our services emit metrics for all useful things, the infra for recording, processing and displaying that is much smaller, maybe two/three instances. Not only that but custom queries are way quicker, and much more resistant to PII leaking. Just like structured logging, it does require some dev effort.
At no point is it _impossible_ to use logs as the data store/transport, its just either fucking expensive, fragile, or dogshit slow.
or to put it another way:
old system == >£1million in licenses and servers (yearly)
metric system == £100k in licenses and servers + £12k for the metrics servers (yearly)
I would say from my experience, for _application logs_, it's the exact opposite. When you deal with a few GB/day of data, you want to have logs, and metrics can be derived from those logs.
Logs are expensive compared to metrics, but they convey a lot more information about the state of your system. You want to move towards metrics over time only one hotspot at a time to reduce cost while keeping observability of your overall system.
I'll take logs over metrics any day of the week, when cost isn't prohibitive.
I was at a large financial news site, They were a total splunk shop. We had lots real steel machines shipping and chunking _loads_ of logs. Every team had a large screen showing off key metrics. Most of the time they were badly maintained and broken, so only the _really_ key metrics worked. Great for finding out what went wrong, terrible at alerting when it went wrong.
However, over the space of about three years we shifted organically over to graphite+grafana. There wasn't a top down push, but once people realised how easy it was to make a dashboard, do templating and generally keep things working, they moved in droves. It also helped that people put metrics emitting system into the underlying hosting app library.
What really sealed the deal was the non-tech business owners making or updating dashboards. They managed to take pure tech metrics and turn them into service/business metrics.
It's fair that you had a different experience than I had. However, your experience seems to be very close to what I was describing. Cost got prohibitive (splunk), and you chose a different avenue. It's totally acceptable to do that, but your experience doesn't reflect mine, and I don't think I'm the exception.
I've used both grafana+metrics and logs to different degrees. I've enjoyed using both, but any system I work on starts with logs and gradually add metrics as needed, it feels like a natural evolution to me, and I've worked at different scale, like you.
I feel like I shouldn't need to mention this, but comparing a news site to a financial exchange with money at stake is not the same. If there is a glitch you need to be able to trace it back and you can't do that with some abstracted metrics.
Yea, on a news site, the metrics are important. If suddenly you start seeing errors accrue above background noise and it's affecting a number of people you can act on it. If it's affecting one user, you probably don't give a shit.
In finance if someone puts and entry for 1,000,000,000 and it changes to 1,000,000 the SEC, fraud investigators, lawyers, banks, and some number of other FLAs are shining a flashlight up your butt as to what happened.
I'm not saying that you can't log, I'm saying that logging _everything_ on debug in an unstructured way and then hoping to devine a signal from it, is madness. You will need logs, as they eventually tell you what went wrong. But they are very bad at telling you that something is going wrong now.
Its also exceptionally bad at allowing you quickly pinpointing _when_ something changed.
Even in a logging only environment, you get an alert, you look at the graphs, then dive into the logs. The big issue is that those metrics are out of date, hard to derrive and prone to breaking when you make changes.
verbose logging is not a protection in a financial market, because if something goes wrong you'll need to process those logs for consumption by a third party. You'll then have to explain why the format changed three times in the two weeks leading up to that event.
Moreover you will need to seperate the money audit trail from the verbose application logs, ideally at source. as its "high value data" you can't be mixing those stream at all
> Logs are expensive compared to metrics, but they convey a lot more information about the state of your system.
My experience has been the kind of opposite.
Yes, you can put more fields in a log, and you can nest stuff. In my experience however, attics tend to give me a clearer picture into the overall state (and behaviour) of my systems. I find them easier and faster to operate, easier to get an automatic chronology going, easier to alert on, etc.
Logs in my apps are mostly relegated to capturing warning error and error states for debugging reference as the metrics give us a quicker and easier indicator of issues.
I’m not well versed in QA/Sysadmin/Logs but surely metrics suffer from Simpson’s paradox compared to properly probed questions only answered through having access to the entirety of the logs?
If you average out metrics across all log files you’re potentially reaching false or worse inverse conclusions about multiple distinct subsets of the logs
It’s part of the reason why statisticians are so pedantic about the wording of their conclusions and to which subpopulation their conclusions actually apply to
When performing forensic analysis, metrics don't usually help that much. I'd rather sift 2PB of logs, knowing that information I'm looking for is in there, than sit at the usual "2 weeks of nginx access logs which roll over".
Obviously running everything with debug logging just burns through money, but having decent logs can help a lot other teams, not just the ones working on the project (developers, sysadmins, etc.)
Metrics are useful when you know what to measure, which implies that you already have a good idea for what can go wrong. If your entire product exists in some cloud servers that you fully control, that's probably feasible. Binance probably could have done something more elegant than storing extraordinary amounts of logs.
However, if you're selling a physical product, and/or a service that integrates deeply with third party products/services, it becomes a lot more difficult to determine what's even worth measuring. A conservative approach to metrics collection will limit the usefulness of the metrics, for obvious reasons. A "kitchen sink" approach will take you right back to the same "data volume" problem you had with logs, but now your developers have to deal with more friction when creating diagnostics. Neither extreme is desirable, and finding the middle ground would require information that you simply don't have.
On a related note, one approach I've found useful (at a certain scale) is to shove metrics inside of the logs themselves. Put a machine-readable suffix on your human-readable log messages. The resulting system requires no more infrastructure than what your logs are already using, and you get a reliable timeline of when certain metrics appear vs. when certain log messages appear.
I'm trying to offer the perspective of someone who works with products that don't exist entirely on a server. If your product is a web service, the following might not apply to you.
IME creating diagnostic systems for various IoT and industrial devices, the "natural" stuff is relatively easy to implement (battery level, RSSI, connection state, etc) but it's rarely informative. In other words, it doesn't meaningfully correlate with the health of the system unless failure is already imminent.
It's the obscure stuff that tends to be informative (routing table state, delivery ratio, etc). But, complex metrics demand a greater engineering lift in their development and testing. There's also a non-trivial amount of effort involved in developing tools to interpret the resulting data.
Even if natural and informative were tightly correlated, which they aren't, an informative metric isn't necessarily actionable. You have to be able to use the data to improve your product. I can't charge the battery in a customer's device for them. I also can't move their phone closer to a cell tower. If you can't act on a metric, you're just wasting your time.
Fine, but I'm now wondering what sort of "data" is going to help you "charge the battery in a customer's device for them [or] move their phone closer to a cell tower."
A natural metric for a distributed system is connectivity (or conversely partition detection). A metric on connectivity is informative. Can the information help you heal the partition? Maybe, maybe not. Time to hit the logs and see why the partition occurred and if an actionable remedy is possible.
(I'm trying to understand your pov btw, so clarify as you will.)
> I'm now wondering what sort of "data" is going to help you "charge the battery in a customer's device for them [or] move their phone closer to a cell tower."
None. The idea is that you have to think about what you'd actually do with that data once you've collected. If it's something that far-fetched, it isn't worth collecting that data. (This philosphy is also convenient for GDPR reasons)
Distributed systems are one place where metrics can be genuinely useful. They can be good at reducing the complexity of a bunch of interacting nodes down to something a bit more digestible. Distributed systems have their own fascinating technical challenges. One of the less-fascinating difficulties is that you're at the mercy of your client's IT. If they don't want their devices phoning home, you don't get real-time metrics. You might be able to store some stuff for offline diagnostic purposes, but other practical limits arise from there.
How do you detect partitions? You could have each device periodically record a snapshot of its routing table, but then if you wanted to identify the partition, you'd have to go fetch data from each node individually. So, maybe you have them share their routing tables with each other, thereby allowing the partition detection to happen on the fly. That's great, but now you're using precious, precious bandwidth hurling around diagnostic data that you might not even be able to access in practice. There's really no right answer here.
When you have metrics, you should also keep sampled logs.
Ie. 1 per million log entries is kept. Write some rules to try and keep more of the more interesting ones.
One way to do this is to have your logging macro include the source file and line number the logline came from, and then, for each file and line number emit/store no more than 1 logline per minute.
That way you get detailed records of rare events, while filtering most of the noise.
There are also different types of logs. Maybe you want every transaction action but don't need a full fidelity copy of every load balancer ping from the last ten years.
I’ve got to disagree here, especially with memoization and streaming, deriving metric from structured logs is extremely flexible, relatively fast, and can be configured to be as cheap as you need it to be. With streaming you can literally run your workload on a raspberry pi. Granted, you need to write the code to do so yourself, most off-the-shelf services probably are expensive
memoization isn't free in logs, you're basically deduping an unbounded queue and its difficult to scale from one machine. Its both CPU and Memory heavy. I mean sure you can use scuba, which is great, but that's basically a database made to look like a log store.
> deriving metric from structured logs is extremely flexible
Assuming you can actually generate structured logs reliably. but even if you do, its really easy to silently break it.
> With streaming you can literally run your workload on a raspberry pi
no, you really can't. Streaming logs to a centralised place is exceptionally IO heavy. If you want to generate metrics from it, its CPU heavy as well. If you need speed, then you'll also need lots of RAM, otherwise searching your logs will cause logging to stop. (either because you've run out of CPU, or you've just caused the VFS cache to drop because you're suddenly doing no predictable IO. )
greylog exists for streaming logs. hell, even rsyslog does it. Transporting logs is fairly simple, storing and generating signal from it is very much not.
> Most log messages are useless 99.99% of the time.
Things are useless until first crash happens, same thing applies to replication, you don't need replication until your servers start crashing.
> But logs shouldn't be your primary source of data, metrics should be.
There are different types of data related to the product:
    * product data - what's in your db
    * logs - human readable details of a journey for a single request
    * metrics - approximate health state of overall system, where storing high cardinality values are bad (e.g. customer_uuid)
    * traces - approximate details of a single request to be able to analyze request journey through systems, where storing high cardinality values might still be bad.
Logs are useful, but costly. Just like everything else which makes system more reliable
Just to be sure, I'm speaking below about application/system logs, not as "our event sourcing uses log storage"
Yes, you probably don't want to store debug logs of 2 years ago, but logs and metrics solve very different problems.
Logs need to have determined lifecycle, e.g. most detailed logs are stored for 7/14/30/release cadence days, then discarded. But when you need to troubleshoot something, metrics give you signal, but logs give you information about what was going on.
> Most log messages are useless 99.99% of the time. Best likely outcome is that its turned into a metric. The once in the blue moon outcome is that it tells you what went wrong when something crashed.
Wonder if just keeping timestamps in a more efficient table of each unique textual log entry would be better? Or rather log entry text template. Then store the arguments also separate.
"Once in a blue moon" -- you mean the thing that constantly happens? If you're not using logs, you're not practicing engineering. Metrics can't really diagnose problems.
It's also a lot easier to inspect a log stream that maps to an alert with a trace id than it is to assemble a pile of metrics for each user action.
I think the above comment is just saying that you shouldn't use logs to do the job of metrics. Like, if you have an alert that goes off when some HTTP server is sending lots of 5xx, that shouldn't rely on parsing logs.
> But logs shouldn't be your primary source of data, metrics should be.
Metrics, logs, relational data, KVs, indexes, flat files, etc. are all equally valid forms of data for different shapes of data and different access patterns. If you are building for a one-size-fits-all database you are in for a nasty surprise.
With logs you can get an idea of what events happened in what order during some complex process, stretched over long timeframe, and so on. I don't think you can do this with a metric
> With logs you can get an idea of what events happened in what order
Again, if you're at that point, you need logs. But thats never going to be your primary source of information. if you have more than a few services running at many transactions a second, you can't scale that kind of understanding using logs.
This is my point, if you have >100 services, each with many tens or hundreds of processes, your primary (well it shouldn't be, you need pre SLA fuckup alerts)alert to something going wrong is something breeching an SLA. That's almost certainly a metric. Using logs to derive that metric means you have a latency of 60-1500 seconds
Getting your apps to emit metrics directly means that you are able to make things much more observable. It also forces your devs to think about _how_ their app is observed.
I would note that a notional "log store", doesn't have to just be used for things that are literally "logs."
You know what else you could call a log store? A CQRS/ES event store.
(Specifically, a "log store" is a CQRS/ES event store that just so happens to also remember a primary-source textual representation for each structured event-document it ingests — i.e. the original "log line" — so that it can spit "log lines" back out unchanged from their input form when asked. But it might not even have this feature, if it's a structured log store that expects all "log lines" to be "structured logging" formatted, JSON, etc.)
And you know what the most important operation a CQRS/ES event store performs is? A continuous streaming-reduction over particular filtered subsets of the events, to compute CQRS "aggregates" (= live snapshot states / incremental state deltas, which you then continuously load into a data warehouse to power the "query" part of CQRS.)
Most CQRS/ES event stores are built atop message queues (like Kafka), or row-stores (like Postgres). But neither are actually very good backends for powering the "ad-hoc-filtered incremental large-batch streaming" operation.
• With an MQ backend, streaming is easy, but MQs maintain no indices for events per se, just copies of events in different topics; so filtered streaming would either have the filtering occur mostly client-side; or would involve a bolt-on component that is its own "client-side", ala Kafka Streams. You can use topics for this — but only if you know exactly what reduction event-type-sets you'll need before you start publishing any events. Or if you're willing to keep an archival topic of every-event-ever online, so that you can stream over it to retroactively build new filtered topics.
• With a row-store backend, filtered streaming without pre-indexing is tenable — it's a query plan consisting of a primary-key-index-directed seq scan with a filter node. But it's still a lot more expensive than it'd be to just be streaming through a flat file containing the same data, since a seq scan is going to be reading+materializing+discarding all the rows that don't match the filtering rule. You can create (partial!) indices to avoid this — and nicely-enough, in a row-store, you can do this retroactively, once you figure out what the needs of a given reduction job are. But it's still a DBA task rather than a dev task — the data warehouse needs to be tweaked to respond to the needs of the app, every time the needs of the app change. (I would also mention something about schema flexibility here, but Postgres has a JSON column type, and I presume CQRS/ES event-store backends would just use that.)
A CQRS/ES event store built atop a fully-indexed document store / "index store" like ElasticSearch (or Quickwit, apparently) would have all the same advantages of the RDBMS approach, but wouldn't require any manual index creation.
Such a store would perform as if you took the RDBMS version of the solution, and then wrote a little insert-trigger stored-procedure that reads the JSON documents out of each row, finds any novel keys in them, and creates a new partial index for each such novel key. (Except with much lower storage-overhead — because in an "index store" all the indices share data; and much better ability to combine use of multiple "indices", as in an "index store" these are often not actually separate indices at all, but just one index where the key is part of the index.)
---
That being said, you know what you can use the CQRS/ES model for? Reducing your literal "logs" into metrics, as a continuous write-through reduction — to allow your platform to write log events, but have its associated observability platform read back pre-aggregated metrics time-series data, rather than having to crunch over logs itself at query time.
And AFAIK, this "modelling of log messages as CQRS/ES events in a CQRS/ES event store, so that you can do CQRS/ES reductions to them to compute metrics as aggregates" approach is already widely in use — but just not much talked about.
For example, when you use Google Cloud Logging, Google seems to be shoving your log messages into something approximating an event-store — and specifically, one with exactly the filtered-streaming-cost semantics of an "index store" like ElasticSearch (even though they're actually probably using a structured column-store architecture, i.e. "BigTable but append-only and therefore serverless.") And this event store then powers Cloud Logging's "logs-based metrics" reductions (https://cloud.google.com/logging/docs/logs-based-metrics).
There was a time at the beginning of the pandemic where my team was asked to build a full text search engine on top of a bunch of SharePoint sites in under 2 weeks and with frustratingly severe infrastructure constraints, (No cloud services, single box on prem for processing, among other things), and we did and it served its purpose for a few years. Absolutely no one should emulate what we built, but it was an interesting puzzle to work on and we were able to cut through a lot of bureaucracy quickly that had held us back for a few years wrt accessing the sensitive data they needed to search.
But I was always looking for other options for rebuilding the service within those constraints and found Quickwit when it was under active development. I really admire their work ethic and their engineering. Beautifully simple software that tends to Just Work™. It's also one of the first projects that made me really understand people's appreciation for Rust as well outside of just loving Cargo.
I don't know what brings me more happiness in this career. Building systems with no political constraints, or building something that's functional with severe restraints.
> we were able to cut through a lot of bureaucracy quickly that had held us back for a few years wrt accessing the sensitive data they needed to search
Yeah, this seems like a weird way to interpret what I said. I just meant we got in front of the right people to get permission, which we were already waiting to do for quite a while before the pandemic.
I wonder how much their setup costs. Naively, if one were to simply feed 100 PB into Google BigQuery without any further engineering efforts, it would cost about 3 million USD per month.
For indexing, they need 2800 vCPUs[1], and they are using c6g instances; on-demand hourly price is $0.034/h per vCPU.
So indexing will cost them around $70k/month.
For search, they need 1200 vCPUs, it will cost them around $30k/month.
For storage, it will cost them $23/TB * 20000 = $460k/month.
Storage costs are an issue. Of course, they pay less than $23/TB but it's still expensive. They are optimizing this either by using different storage classes or by moving data to cheaper cloud providers for long term storage (less requests mean you need less performant storage and usually you can get a very good price on those object storages).
On quickwit side, we will also improve the compression ratio to reduce the storage footprint.
[1]: I fixed the num vCPUs number of indexing, it was written 4000 when I published the post, but it corresponded to the total number of vCPUs for search and indexing.
At this level they can just go bare metal or colo. Use Hetzner's pricing as reference. Logs don't need the same level of durability as user data, some level of failure is perfectly fine. I would estimate 100k per month or less, maximum 200K.
You can get a spinning disk of 18TB (not need for SSD if you can parallel write) for 224€. Let's round that to $300 for easy calculations.
To store 100 petabytes of data by purchasing disks yourself, you would need approximately 5556 18TB hard drives totaling $1,666,800.
Of course, you'll pay more than the disks.
Let's add the cost of 93 enclosures at $3,000 each ($279,000), and accounting for controllers, network equipment ($100,000), and power and cooling infrastructure ($50,000, although it's probably already cool where they will host the thing), that would be a about $2.1 M.
That's total, and that's for the uncompressed data.
You would need 3 times that for redundancy, but it would still be 40% cheaper over 5 years, not to mention I used retail price. With their purchasing power they can get a big discount.
Now, you do have the cost of having a team to maintain the whole thing but they likely have their own data center anyway if they go that route.
> disk of 18TB (not need for SSD if you can parallel write)
Do note that you can put, like, at most?, 1TB of hot/warm data on this 18TB drive.
Imagine you do a query, and 100GB of the data to be searched are on 1 HDD. You will wait 500s-1000s just for this hard drive. Imagine a bit higher concurrency with searching on this HDD, like 3 or 5 queries.
You can't fill these drives full with hot or warm data.
> To store 100 petabytes of data by purchasing disks yourself, you would need approximately 5556 18TB hard drives totaling $1,666,800.
You want to have 1000x more drives and only fill 1/1000 of them. Now you can do a parallel read!
For this purpose you would likely not buy ordinary consumer disks but rather bullet proof enterprise HDDs. Otherwise a signifcant amount of the 5556 disks would not survive the first year, assuming the are under constant load.
quickwit's big advantage is that you can target it at something that speaks S3 and it will be happy. so ideally you delegate the whole storage story by hiring someone who knows their way around Ceph (erasure coding, load distribution) and call a few DC/colo/hosting providers (initial setup and the regular HW replacements).
Good question. I thought it would be a no brainer to put it on s3 or similiar but thats already way to expensive at 2m/month without api requests.
Backplace storage pods are an initial investment of 5 Million, thats probably the best bet you could do and on that savings level, having 1-3 good people dedicated to this is probably still cheaper.
But you could / should start talking to the big cloud providers to see if they are flexible enough going lower on the price.
I have seen enough companies, including big ones, being absolut shitty in optimizing these types of things. At this level of data, i would optimize everyting including encoding, date format etc.
But i said it in my other comment: the interesting questions are not answered :D
Indeed. They benefit from a discount, but we don't know the discount figure.
To further reduce the storage costs, you can use S3 Storage Classes or cheaper object storage like Alibaba for longer retention. Quickwit does not handle that, so you need to handle this yourself, though.
Logs should compress better than that, though, right? 5:1 compression is only about half as good as you'd expect even naive gzipped json to achieve, and even that is an order of magnitude worse than the state of the art for logs[1]. What's the story there?
"Object storage as the primary storage: All indexed data remains on object storage, removing the need for provisioning and managing storage on the cluster side."
So the underlying storage is still Object storage, so base that around your calculations depending if you are using S3, GCP Object Storage, self hosted Ceph, MinIO, Garage or SeaweedFS.
Yeah, doing some preferred cloud Data Warehouse with an indexing layer seems fine for this sort of thing. That has an advantage over something specialized like this of still being able to easily do stream processing / Spark / etc, plus probably saves some money.
Maybe Quickwit is that indexing layer in this case? I haven't dug too much into the general state of cloud dw indexing.
Quickwit is designed to do full-text search efficiently with an index stored on an object storage.
There are no equivalent technology, apart maybe:
- Chaossearch but it is hard to tell because they are not opensource and do not share their internals. (if someone from chaossearch wants to comment?)
- Elasticsearch makes it possible to search into an index archived on S3. This is still a super useful feature as a way to search punctually into your archived data, but it would be too slow and too expensive (it generates a lot of GET requests) to use as your everyday "main" log search index.
Its not hard at all to scale to PB. Junk your data based on time, scale horizontally. When you can scale horizontally it doesn't matter how much it is.
Elastic is not something i would use for scaling horizontally basic logs, i would use it for live data which i need live with little latency or if i do constantly a lot of log analysis live again.
Did Binance really needed elastic or did they just start pushing everything into elastic without every looking left and right?
Did they do any log processing and cleanup before?
This is their application logs. They need to search into it in a comfortable manner. They went for a search engine with Elasticsearch at first, and Quickwit after that because even after restriction the search on a tag and a time window "grepping" was not a viable option.
This position has always confused me. IME logs search tools (ELK and their SaaS ilk) are always far too restrictive and uncomfortable compared to Hadoop/Spark. I'd much rather have unfettered access to the data and have to wait a couple seconds for my query to return than be pigeonholed into some horrible DSL built around an indexing scheme. I couldn't care less about my logs queries returning in sub-second time, it's just not a requirement. The fact that people index logs is baffling.
If you can limit your research to GBs of logs, I kind of agree with you.
It's ok if a log search request takes 100ms instead of 2s,
and the "grep" approach is more flexible.
Usually our users search into > 1TB.
Let's imagine you have to search into 10TB (even after time/tag pruning).
Distributing over 10k cores over 2 second is not practical and does not always economically make sense.
The question is why would someone need search through TBs of data.
If you are not google cloud and just have your workers ready to stream all data in parallel on x amount of workers in parallel, i would force usefull limitations and for broad searches, i would add a background system.
Start your query, come back later or get streaming results.
On the other hand, if not toooo many people search in parallel constantly and you go with data pods like backblaze, just add a little bit more cpu and memory and use the cpu of the datapods for parallisation. Should still be much cheaper than putting it on s3 / cloud.
I guess I was a little too prescriptive with "a couple seconds". What I really meant was a timescale of seconds to minutes is fine, probably five minutes is too long.
> Let's imagine you have to search into 10TB (even after time/tag pruning).
I'd love to know more about this. How frequently do users need to scan 10TB of data? Assuming it's all on one machine on a disk that supports a conservative 250MB/s sequential throughout (and your grep can also run at 250MB/s) that's about 11hr, so you could get it down to 4min on a cluster with 150 disks.
But I still have trouble believing they actually need to scan 10TB each time. I guess a real world example would help.
EDIT: To be clear, I really like quickwit, and what they've done here is really technically impressive! I don't mean to disparage this effort on its technical merits, I just have trouble understanding where the impulse to index everything comes from when applied specifically to the problem of logging and logs analysis. It seems like a poor fit.
No, what I'm doing is analysis on logs. That could be as simple as "find me the first N occurrences of this pattern" (which you might call search) but includes things like "compute the distribution of request latencies for requests affected by a certain bug" or "find all the tenants impacted by a certain bug, whose signature may be complex and span multiple services across a long timescale".
Good luck doing that in a timely manner with Kibana. Indexed search is completely useless in this case, and it solves a problem (retrieval latency) I don't (and, I claim, you don't) have.
EDIT: another way to look at this is the companies I've worked at where I've been able to actually do detailed analysis on the logs (they were stored sensibly such that I could run mapreduce jobs over them) I never reached a point where a problem was unsolvable. These days where we're often stuck with a restrictive "logs search solution as a service" I often run into situations where the answer simply isn't obtainable. Which situation is better for customers? I guess cynically you could say being unable to get to the bottom of an issue keeps me timeboxed and focused on feature development instead of fixing bugs.. I don't think anyone but the most craven get-rich-quick money grubber would actually believe that's better though.
The data is just Binance's application logs for observability.
Typically what a smaller business would simply send to Datadog.
This log search infra is handled by two engineers who do that for the entire company.
They have some standardized log format that all teams are required to observe, but they have little control on how much data is logged by each service.
Financial institutions have to log a lot just to comply with regulations, including every user activity and every money flow. On an exchange that does billions of operation per seconds, often with bots, that's a lot.
Yes but audit requirements doesn't mean you need to be able to search everything very fast.
Binance might not have a 24/7 constant load, there might be plenty of time to compact and write audit data away at lower load while leveraging existing infrastructure.
Or extracting audit logging into binary format like protobuff and writing it away highly optimized.
Binance boss just came out of prison, so he is not above the law.
And yes, they likely have this problem, because crypto is less regulated and full of geeks, so they have way more automation compared to traditional finance, at least proportionally to its size. You have bots on top of bots (literally, like telegram bots that will send orders to other bots copy-trading other bots).
In fact, there is even an old altcoin dedicated to automation: kryll (https://www.kryll.io/). They have a full no-code UI to create a trading bot with complex strategies that is pretty well done, from a purely technical perspective. They plug into many exchanges, including Binance.
Also, because it's less regulated, copy trading/referral/stacking is the Wild West, and they generate a lot of operations and fees.
What would you use for storing and querying long-term audit logs (e.g. 6 months retention), which should be searchable with subsecond latency and would serve 10k
writes per second?
AFAICT this system feels like a decent choice. Alternatives?
"So subsecond I would say is a requirement." you do not make any specific point why you came to that conclusion.
You can easily entertain users to show them that the system is doing something in the background without loosing them and if they are collegues who actually need to search, you don't even need to keep them as they have to use your setup.
Do you know any specific case studies for unstructured logs on clickhouse?
I think achieving sub-second read latency of adhoc text searching over ~150B rows of unstructured data is going to be quite challenging without a high cost. Clickhouse’s inverted indices are still experimental.
If the data can be organized in a way that is conducive to the searching itself, or structured it into columns, that’s definitely possible. Otherwise I suppose a large number of CPUs (150-300) to split the job and just brute force each search?
NATS doesn't really have advanced query features though. It has a lot of really nice things, but advanced querying isn't one of them. Not to mention I don't know if NATS does well with large datasets, does it have sharding capability for it's KV and object stores?
I use NATS at work, and I have had the privilege to speak with some of the folks at Synadia about this stuff.
Re: advanced querying: the recommended way to do this is to build an index out of band (like Redis (or a fork) or SQLite or something) that references the stored messages by sequence number. By doing that, your index is just this ephemeral thing that can be dynamically built to exactly optimize for the queries you're using it for.
Re: sharding: no, it doesn't support simple sharding. You can achieve sharding by standing up multiple NATS instances, and making a new stream (KV and object store are also just streams) on each instance, and capture some subset of the stream on each instance. The client (or perhaps a service querying on behalf of the client) would have to me smart enough to be able to mux the sources together.
Does it handle clustering/redundancy for the data stored in KV/object store? My intuition says yes because I believe it supports it at the "node" level
I am having trouble understand how any organization could ever need a collection of logs larger than the size of the entire Internet Archive. 100PB is staggering, and the idea of filling that with logs, while entirely possible, just seems completely useless given the cost of managing that kind of data.
This is on a technical level quite impressive though, don't get me wrong, I just don't understand the use case.
These are order and trade logs probably. You want to have them and you need them for auditing. Binance wants to be more professional in that way probably. HFT is making billions of orders per day per trader.
OK, so let's do some napkin math... I'm guessing something like this is the information you might want to log:
user ID: 128bits
timestamp: 96bits
ip address: 32bits
coin type: idk 32bits? how many fake internet money types can there be?
price: 32bits
quantity: 32bits
So total we have 352bits. Now let's double it for teh lulz so 704bits wtf not. You know what fuck it let's just round up to 1024bits. Each trade is 128bytes why not, that's a nice number.
That means 200Pb--2e17 bytes mind you--is enough to store 1.5625e16 trades. If all the traders are doing 1e9 trades/day, and we assume this dataset is 13mo of data, that means there are 38772 HFT traders all simultaneously making 11574 trades per second.. That seems like a lot..
In other words, that means Binance is processing 448.75 million orders per second.. Are they though?
EDIT: No, indeed some googling indicates they claim they can process something like 1.4 million TPS. But I'd hazard a guess the actual figure on average is less..
EDIT: err sorry, shoulda been 100Pb. Divide all those numbers by two. Still two orders of magnitude worth of absurd.
The only thing I can think of is that they are collecting every single line of log data from every single production server with absolutely zero expiration so that they can backtrack any future attack with precision, maybe even finding the original breach.
That's the only actual use case I can think of for something like this, which makes sense for a cryptocurrency exchange that is certainly expecting to get hacked at some point.
Same, also I'd love to know more about the technical details of their logging format, the on-disk storage format, and why they were only able to reduce the storage size to 20% of the uncompressed size. For example, clp[1] can achieve much, much better compression on logs data.
Exactly! Which is again one of the reasons it's confusing that people apply full text search technology to logs. Machine logs are quite a lot less entropic than human prose, and therefore can be compressed a whole lot better. A corrollary is that because of the redundancy in the data "grepping" the compressed form can be very fast, so long as the compression scheme allows it.
If the query infrastructure operating on these compressed data is itself able to store intermediate results, then we've killed two birds with one stone because we've also gotten rid of the restrictive query language. That's how cascading mapreduce jobs (or Spark) does it, allowing users to perform complex analyses that are entirely off the table if they're restricted to the lucene query language. Imagine a world where your SQL database was one giant table and only allowed you to query it with SELECT. That's pretty limiting, right?
So as a technology demonstration of Quickwit this seems really cool--it can clearly scale!--but it's kind of also an indictment of Binance (and all the other companies doing ELKish things out there).
>Limited Retention: Binance was retaining most logs for only a few days. Their goal was to extend this to months, requiring the storage and management of 100 PB of logs, which was prohibitively expensive and complex with their Elasticsearch setup.
Just to give some perspective. The Internet Archive, as of January 2024, attests to have stored ~ 99 petabytes of data.
Can someone from Binance/quickwit comment on their use case that needed log retention for months? I have rarely seen users try to access actionable _operations_ log data beyond 30 days.
I wonder how much $$ can they save more by leveraging tiered storage and engs being mindful of logging.
Government regulators take their time and may not investigate or alert firms to identified theft, vulnerability, criminal or sanctioned country user trails for months. However, that does not protect those companies from liability. There is recent pressure and targeted prosecution from the US on Binance and CZ along this angle. They've been burned on US users getting into their international exchange, so keeping longer forensic logs helps surveil, identify, and restrict Americans better (as well as the bad guys they're not supposed to interact with).
If it's 181 trillion each year, it's only 6 million per second.
There's a thousand milliseconds in each second so Binance would need only several thousand high frequency traders creating, and adjusting orders, through their API, to end up with those logs.
Binance has hundreds of trading pairs available so a handful on each pair average would add up.
Yeah I don't get it either, something seems deeply wrong here.
These are impressive numbers but I wonder about something... Binance is a centralized cryptocurrencies exchange. But AIUI "defi" is a thing: instead of using a CEX (Centralized EXchange), people can use a DEX (Decentralized EXchange).
And apparently there's a gigantic number of trades happening in the defi world. And it's all happening on public ledgers right? (I'm asking, I don't know: are the "level 2" chains public?).
And the sum of all the public ledgers / blockchains transactions do not represent anywhere near 1.6 PB a day.
And yet DEXes do work (and often now, seen that volume picked up, have liquidity and fees cheaper than centralized exchanges).
Someone who know this stuff better than I do could comment but from a quick googling here's what I found:
    - a full Ethereum node today is 1.2 TB (not PB, but TB)
    - a full Bitcoin node today is 585 GB
There are other blockchains but these two are the two most successful ones?
So let's take Ethereum... For 1.2 TB you have the history of all the transactions that ever happened on Ethereum, since 2015 or something. And that's not just Ethereum but also all the "tokens" and "NFTs" on ethereum, including stablecoins like Circle/Coinbase's USDC.
How do we go from a decentralized "1.2 TB for the entire Ethereum history" to "1.6 PB per day for Binance transactions"?
That's 1500x the size of the freaking entire Ethereum blockchain generated by logs, in a day.
And Ethereum is, basically, a public ledger. So it is... Logs?
Or let's compared Binance's numbers to, say, the US equities options market. That feed is a bit less than 40 Gb/s I think, so 140 TB for a day of actual equities options trading datafeed.
I understand these aren't "logs" but, same thing...
How do we go from a daily 140 TB datafeed from the CBOE (where the big guys are and the real stuff if happening) to 10x that amount in daily Binance logs.
Something doesn't sound right.
You can say it's apples vs oranges but I don't it's that much of apples vs oranges.
I mean: if these 1.6 PB of Binance logs per day are justified, it makes me think it's time to sell everything and go all-in in cryptocurrencies, because there may be way more interest and activity than people think. (yeah, I'm kidding)
EDIT: 1.2 TB for Ethereum seems to be a full but not an "archive" node. An "archive" node is 6 TB. Still a far cry from 1.6 PB a day.
Archive node can go as low as ~2TB depending on the client, but regardless you do want to compare it to a full node, as the only difference is an "archive" node keeps the state at any block (e.g you want to replay a transaction that occured in the past, or see a state at a certain block). The full nodes still contain all events/txs (DEXes will emit events, akin to logs, for transfers) - so it's fair to compare it to a full node.
On CEXes you see a lot more trades, market makers/high frequency trades just doing a ton of volume/creating orders and so on, since it's a lot cheaper. CEXes without a doubt have more trades than DEX by orders of magnitude.
Additionally, they probably log multiple stuff for every request, including API request, which they most definitely get a ton of.
Albeit 1.6PB/day may be somewhat exaggerated, comparing Binance to Ethereum needs much more consideration including:
- Ethereum's transaction throughput is normally 12~20tx/sec so there cannot be a "high-frequency trades" on Ethereum smart contracts with naive contract interaction(it will cost enormous fees). There are scaling concept like "layer-2" or "layer-3", but they still cannot beat highly optimized centralized server applications. Decentralized exchanges have different schemes to centralized ones to reduce txs to discover the price(keyword: AMM, "automated market maker")
- The transactions per sec metrics are just recording "confirmed" txs by the blockchain, and many "retail-squeezing" trading txs (called MEV, maximal value extraction) are competing behind the blockchain and only one tx is chosen by the blockchain, which will rebate most profits to the blockchain validator(which is analogous to the HFTs on the centralized exchanges).
- The blog post's argument would count all logs of intermediate hops, like L7/L4 proxy and matching engine and so on, and Ethereum's full node storage is only a single component which is almost like a non-parallelized matching engine. Maybe we should also count logs of public RPC nodes of Ethereum? (Also many txs are not gossiped to the public mempool so these are hard to count)
Defi is a fraction of whats happening on cefi exchanges. I have a customer placing hundreds of billions of orders per day on binance. And they are by far not the biggest players there.
> On a given high-throughput Kafka topic, this figure goes up to 11 MB/s per vCPU.
There's got to be 2x to 10x improvement to be made there, no? No way CPU is the limitation these days and even bad hard drives will support 50+mB/s write speeds.
Building an inverted index is actually very cpu intensive. I think we are the fastest on that (if someone knows something faster than tantivy at indexing I am interested).
I'd be really surprised if you can make a 10x improvement here.
The article talks about 1.6 PB / day, which is 150 Gbps of log ingest traffic sustained. That's insane.
A change of the logging protocol to a more efficient format would yield such a huge improvement that it would be much cheaper than this infrastructure engineering exercise.
I suspect that everyone just assumes that the numbers represent the underling data volume, and that this cannot be decreased. Nobody seems to have heard of write amplification.
Let's say you want to collect a metric. If you do this with a JSON document format you'd likely end up ingesting records that are like the following made-up example:
It wouldn't surprise me if in reality this was actually 10x larger. For example, just the "resource id" of something in Azure is about this size, and it's just one field of many collected by every logging system in that cloud for every record. Similarly, I've cracked open the protocols and schema formats for competing systems and found 300x or worse write amplification being the typical case.
The actual data that needed to be collected was just:
391235.23921386
In a binary format that would be 4 bytes, 8 if you think that you need to draw your metric graphs with a vertical precision of a millionth of a pixel and horizontal precision of a minute because you can't afford the exabytes of storage a higher collection frequency would require.
If you collect 4 bytes per metric in an array and record the start timestamp and the interval, you don't even need a timestamp per entry, just one per thousand or whatever. For a metric collected every second that's just 10 MB per month before compression. Most metrics change slowly or not at all and would compress down to mere kilobytes.
Why do so many companies insist on shipping their logs via Kafka? I can't imagine deliverability semantics are necessary with logs, and if they are, they shouldn't be in your logs?
Kafka is a big dumb pipe that moves the bytes real fast, it's ideal for shipping logs. It accepts huge volumes of tiny writes without breaking a sweat, which is exactly what you want--get the logs off the box ASAP and persisted somewhere else durably (e.g. replicated).
My experience has been a mixture of "when all you have is a hammer ..." and Pointy Haired Bosses LOVE kafka, and tend to default to it because it's what all their Pointy Haired Boss friends are using
In a more generous take, using some buffered ingest does help with not having to choose between a c500.128xl ingest machine and dropping messages, but I would never advocate for standing up kafka just for log buffering
at that point you are likely slowing down your applications - I think a basic OpenTelemetry collector mostly solves this, and if you go beyond the available buffer there, then dropping it is the appropriate choice for application logs.
Dropping may be an unacceptable choice for some applications, though. For example dropping request logs is really bad, because now you have no idea who is interacting with your service. If a security breach happens and your answer is "like, bro, idk what happened man, we load shedded the logs away" that's not a great look...
In log shipping cases it’s good as a buffer so you can batch writes to the underlying SIEM. This prevents tons of small API calls with a few hundred or thousand log lines each. Instead Kafka will take all the small calls and the SIEM can subscribe and turn them into much larger batches to write to the underlying storage (eg S3).
Don’t forget about all the added cost. never got it as many shops can tolerate data loss for their melt data. So long as it’s collected 99.9% of the time it’s good enough.
tantivy has two dictionaries FST and SSTable. We added SSTable in tantivy because it works great with object storage, while FST does not. With some metadata we can download only the required parts and not the whole dictionary.
SStable does not support Regex queries, it would require a full load and scan, which would be very expensive.
Your best bet currently would be to make it work with tokenizing, which is way more efficient anyways.
Just browsing the Quickwit documentation it seems like the general architecture here is to write JSON logs but stores them compressed. Is this just something like gzip compression? 20% compressed size does seem to align to ballpark estimates of JSON GZIP compression. This is what Quickwit (and this page) calls a "document": a single JSON record (just FYI).
Additionally you need to store indices because this is what you actually search. Indices have a storage cost when you write them too.
When I see a system like this my thoughts go to questions like:
- What happens when you alter an index configuration? Or add or remove an index?
- How quickly do indexes update when this happens?
- What about cold storage?
Data retention is another issue. Indexes have config for retention [1]. It's not immediately clear to me how document retention works, possibly from S3 expiration?
So, network transfer from S3 is relatively expensive ($0.05/GB standard pricing [2] to the Internet, less to AWS regions). This will be a big factor in cost. I'm really curious to know how much all of this actually costs per PB per month.
IME you almost never need to log and store this much data and there's almost no reason to ever store this much. Most logs are useless and you also have to question what the purpose is of any given log. Even if you're logging errors, you're likely to get the exact same value out of 1% sampling of logs than you are with logging everything.
You might even get more value with 1% sampling because your query and monitoring might be a whole lot easier with substantially less data to deal with.
Likewise, metrics tend to work just as well from sampled data.
This post suggests 60 day log retention (100PB / 1.6PB daily). I would probably divide this into:
1. Metrics storage. You can get this from logs but you'll often find it useful to write it directly if you can. Getting it from logs can be error-prone (eg a log format changes, the sampling rate changes and so on);
2. Sampled data, generally for debugging. I would generally try to keep this at 10TB or less;
3. "Offline" data, which you would generally only query if you absolutely had to. This is particularly true on S3, for example, because the write costs are basically zero but the read costs are expensive.
Additionally, you'd want to think about data aggregation as a lot of your logs are only useful when combined in some way
Quickwit (like Elasticsearch/Opensearch) stores you data compressed with ZSTD in a row store, builds a full text search index, and stores some of your fields in a columnar. The "compressed size" includes all of this.
The high compression rate is VERY specific to logs.
- What happens when you alter an index configuration? Or add or remove an index?
Changing an index mapping was not available in 0.8. It is available in main and will be added in 0.9. The change only impacts new data.
- Or add or remove an index?
This is handled since the beginning.
- What about cold storage?
What makes Quickwit special is that we are reading everything is on S3. We adapted our inverted index to make it possible to read straight from S3.
You might think this is crazy slow, but we typically search into TBs of data in less than a second. We have some in RAM cache too, but they are entirely optional.
> 2. Sampled data, generally for debugging. I would generally try to keep this at 10TB or less;
Sometimes, sampling is not possible. For instance, some of Quickwit users (including Binance) use their logs for user support too. A user might come asking details about something fishy that happened 2 months ago.
You have very good questions, I can only guess one answer: s3 network transfer is free for AWS services
Your link[1] said:
  You pay for all bandwidth into and out of Amazon S3, except for the following:
  [...]
  - Data transferred from an Amazon S3 bucket to any AWS service(s) within the same AWS Region as the S3 bucket (including to a different account in the same AWS Region).
Regardless, there's some computer somewhere serving this. How do they service 1.6 PB per day? Are we talking tape backup? Disks? I've seen these mechanical arms that can pick tapes from a stack on a shelf, is that what is used? (example: https://www.osc.edu/sites/default/files/press/images/tapelib...)
For disks that's like ~60/day without redundancy, do they have people just constantly building out and onlining machines in some giant warehouse?
I assume there's built in redundancy and someone's job to go through and replace failed units?
This all sounds like it's absurdly expensive.
And I'd have to assume they deal with at least 100x that scale because they have many other customers.
Like what is that? 6,000 disks a day? Really?
I hear these numbers of petabyte storage frequently. I think Facebook is around 5PB/daily. I've never had to deal with anything that large. Back in the colo days I saw a bunch of places but nothing like that.
I'm imagining forklifts moving around pallets of shrink wrapped drives that get constantly delivered
Am I missing something here?
Places like AWS should run tours. It'd be like going to the mint.
It's always very amusing how all of the blockchain companies wax lyrical about all of the huge supposed benefits of blockchains and how every industry and company is missing out by not adopting them and should definitely run a hyperledger private blockchain buzzword whatever.
And then, even when faced with implementing a huge, audit critical, distributed append-only store, the thing they tell us blockchains are so useful for, they just use normal database tech like the rest if us. With one centralized infrastructure where most of the transactions in the network actually take place. Who's tech stack looks suspiciously like every other financial institution.
I'm so glad we're ignoring 100 years of securities law to let all of this incredible innovation happen.
Binance is not a blockchain company. It is a centealized exchange. Nothing is happening on-chain unless getting coins from or to the exchange. And this has nothing tondo with them then.
> And then, even when faced with implementing a huge, audit critical, distributed append-only store, the thing they tell us blockchains are so useful for, they just use normal database tech like the rest if us. With one centralized infrastructure where most of the transactions in the network actually take place. Who's tech stack looks suspiciously like every other financial institution.
Right but surely you must understand that the blockchain transactions are already stored in the blockchain, and what this is about is logs that might be useful for debugging purposes, and as such would be more verbose than what's required and also could contain sensitive information?
Apart from that isn't it obvious that the performance requirement would make this unrealistic, with no added benefits, whatsoever.
>I'm so glad we're ignoring 100 years of securities law to let all of this incredible innovation happen.
Storing all these logs on a blockchain might very well (apart from being totally asinine) breach privacy regulations as well, as it might very well store sensitive data?
Yes, I understand why blockchains are bad, have no benefits, terrible performance and are a privacy nightmare. Thanks for explaining it in more detail. And binance understands it too, that's why they're not using it (not even a private one!) despite all of their talk about how it's a revolutionary technology.
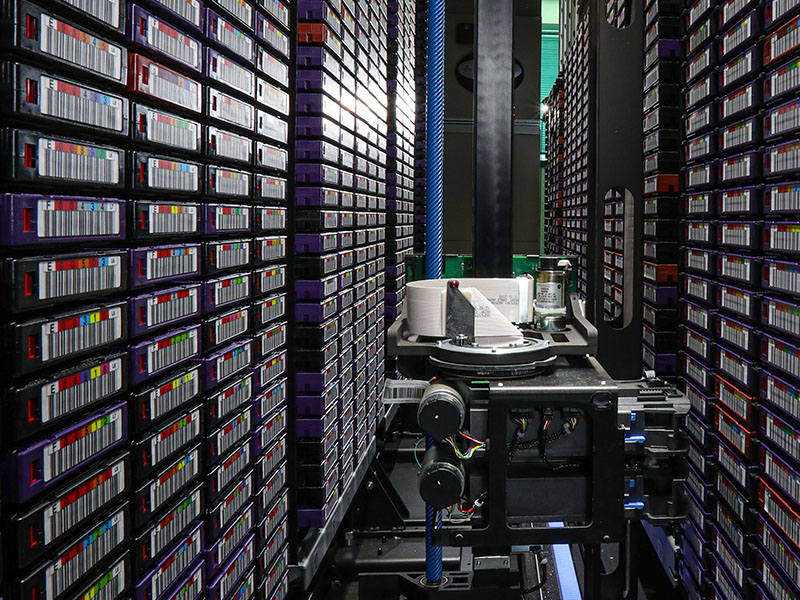
Most log messages are useless 99.99% of the time. Best likely outcome is that its turned into a metric. The once in the blue moon outcome is that it tells you what went wrong when something crashed.
Before you get to shipping _petabytes_ of logs, you really need to start thinking in metrics. Yes, you should log errors, you should also make sure they are stored centrally and are searchable.
But logs shouldn't be your primary source of data, metrics should be.
things like connection time, upstream service count, memory usage, transactions a second, failed transactions, upsteam/downstream end point health should all be metrics emitted by your app(or hosting layer), directly. Don't try and derive it from structured logs. Its fragile, slow and fucking expensive.
comparing, cutting and slicing metrics across processes or even services is simple, with logs its not.