Meanwhile the global temperature anomaly for March 2012 came in at a searing 0.11 degrees C above normal.[1]
But of course more comprehensive data like that isn't quite as attractive.
(I still think the record US March counts more as evidence for global warming than against it. But it's not nearly as strong of evidence as some people wish it to be.)
You know what is interesting about that article? The total lack of statistical insight.
"The average temperature of 51.1 degrees F was 8.6 degrees above the 20th century average for March and 0.5 degrees F warmer than the previous warmest March in 1910."
Without standard deviations, who cares?
And clicking through to the main article, I'm surprised by how many words can be written without saying anything of consequence. Even the graph showing Green Bay temperature looks like nothing more than a plot of noise.
Edit: Now that I think about it, the lack of basic statistical disclosures is pretty damning evidence that nothing significant has happened.
Did you just read the 6 sentence summary without clicking through and looking for the data? Here's a paper used in the analysis which you just read that talks about the uncertainty and standard deviations: ftp://ftp.ncdc.noaa.gov/pub/data/ushcn/v2/monthly/algorithm-uncertainty/
> Edit: Now that I think about it, the lack of basic statistical disclosures is pretty damning evidence that nothing significant has happened.
I happen to work with NOAA and NASA scientists on coupling Earth System Models. NOAA does understand elementary descriptive statistics (so does NASA). Sometimes average temperature distributions are skewed and do not have a finite standard deviation. This is the case for the distribution of annual change in global average temperature, which deviates from a normal distribution (skewed to the right). Sample estimates of standard deviations of global average annual temperature change are meaningless because the standard deviation isn't finite. Instead you'll see measures that are meaningful (mean, min, max). Don't assume that all distributions have finite variance.
I understand what you're saying, but it's also kind of begging the question. We can't calculate a standard deviation because temperatures are rising, but we also can't test if temperatures are unusually warm because we don't have a standard deviation?
I think the message is simple: standard deviations don't provide insight when your main concern is extreme values (max/min temperatures, in this case).
I'm not expert with these data, but your example is not a fair analog. Let's go back to the actual problem.
From a casual glance at the graphs showing past hot years (each one shows 5), NOAA appears to have records for most cities going back to the 1950s (probably 100 years in some cases).
So, in a set of 63 (1950-2012) values, which are themselves average temperatures (and thus representative of some kind of trend, not just a single hot day), the procedure picks out the 5 highest values of average temperature.
It's reasonable to expect that the sequences corresponding to these 5 highest values will be unusual when compared to the other 58. Nothing weird about that.
Of course, if they had only 10 years data, as in your example above, or if they weren't using monthlong averages, it would be a different story.
Standard deviations are one measure of a probability distribution. Order statistics (max and min) are another, and those are given in these graphs in the supplemental information and data page, linked to in the overview section.
I don't think we're looking at the same graphs. The ones I see just plot YTD average temps for the five warmest years. Even the "min" charts are still for the same five years. Except it's different years for every city. There's no way I could get a good sense of the distribution from these charts.
I appreciate that you went ahead and clicked through to the data available, rather than critiquing a press release for not containing enough hard data. Here's why I think the plots did not show standard deviations --
Standard deviations are not an appropriate summary when talking about extreme values.
We're basically conditioning on extreme values ("plot temperatures of all cities having their hottest March on record in 2012"). So, while the standard deviation might be a useful summary of:
P(temperature on day t),
a standard deviation would not be a useful summary of:
P(temperature on day t | average temperature is highest recorded)
In general, after you condition in this way, the events ("sample paths" of the function "temperature at time t") don't look like the rest of the population.
They're oddballs, and by definition, there are only a few of them -- only one March can be the hottest on record. Maybe the best comparison would be the second-hottest March, so plot that one.
There would certainly, for example, be no reason to believe this population looks Gaussian in the tail. In fact, it would probably be misleading to make any assumption about what a "typical" extreme sample looks like. This is probably why just other sample paths (temperature as a function of t) for that location were given, rather than some summary statistic. You can't average oddballs.
There are probably locales for which standard deviation is not ever a useful summary. I'm thinking of places which are subject to strong unpredictable variations, like Santa Ana winds, that are more a 0/1 phenomenon. This would result in a multimodal distribution of temperature, which would make standard deviation misleading. That is, it could be really cold, or rather warm, but unlikely to be in-between.
I think you're confused by the graphs too. They don't plot daily temps, and they aren't even necessarily for the hottest Marches on record. It's all YTD averages. 1998 January in most north east cities was really an extreme value, but if I'm reading the graph right, it was possibly a colder than average March, but the YTD values are buoyed up by January.
Look at DC. Until the last week in March, 1998 is flat or even trending down. That seems like the actual daily temps were possibly below average, no? Whatever, YTD may be pretty to look at it, but I don't think they're good for interpretation. http://www1.ncdc.noaa.gov/pub/data/cmb/images/us/2012/mar/wa...
I just mention this because "temperature at time t" is not what we're looking at.
I don't think you are reading that correctly. If you look at the dip after the spike then all of the spike has already disappeared. Also, as you move to the right it takes an ever larger difference to move the number. Think of it this way, after 10 samples it takes a number 11 above the average to increase the average by one, but after 20 samples it takes a number 21 above the average to increase the average by 1.
So, while the 1998 graph and the 2012 graph look close at the end the actually daily values in 2012 needed to be significantly higher than 1998 values to create that much separation when they so recently crossed each other.
Infact it's actually 1976 that had the most comparable march from the sample given. However, because those years where chosen because their jan - march average was so far above the average it does not really show how abnormal 2012 was. Consider, where the average is and how many colder years it takes to average out to that.
You're right, "temp. at time t" is not plotted. I don't know the reason for that -- presumably they're using YTD average as a running diagnostic to tell if the current year is especially hot.
Do you get standard deviations when you watch the summary today's weather on the news? I think the statistical detail was appropriate.
If you are seriously proposing that standard deviation makes an average 8.6 degrees above normal insignificant then you are going to have to present some pretty compelling evidence. NOAA do generally know how to do some basic math.
A standard deviation of greater than 4.48 degrees would make 8.6 degrees above average insignificant, assuming a normal distribution (alpha = 0.05, two-sided Z-test).
I do understand what standard deviation is, and I do understand that it is possible that a 8.6 degrees difference would be significant. What I meant was that NOAA wouldn't be highlighting this unless it was.
Anyway, it's public data, and we can settle this pretty easily, right?
I other words, (again, if your calculations are correct) if this were a typical HN discussion about A/B testing a conversion goal, we'd all be ridiculing anybody who suggested a result almost 3 standard deviations from the mean _wasn't_ "statistically significant", yet climate change (sceptics|denialists) will no doubt _still_ argue the relevance of this…
The bigger problem (as others have alluded to) is that we don't really know what the tail of the distribution looks like. There's no obvious reason to think it's gaussian.
If the standard deviation is 10, then 8.6 degrees above the mean is insignificant. Providing a number like 8.6 without the s.d. is presenting zero evidence. That's like page two of my statistics textbook.
I was replying to the parent comment, not the story, and the claim that we could somehow determine the significance of 8.6 without knowing more. As for press releases, "It was hot" is probably a sufficient level of detail for most people. :)
> Now that I think about it, the lack of basic statistical disclosures is pretty damning evidence that nothing significant has happened.
I agree with the rest of your post, but come on, this is just silly. Absence of evidence (on one particular website) is certainly not evidence of absence.
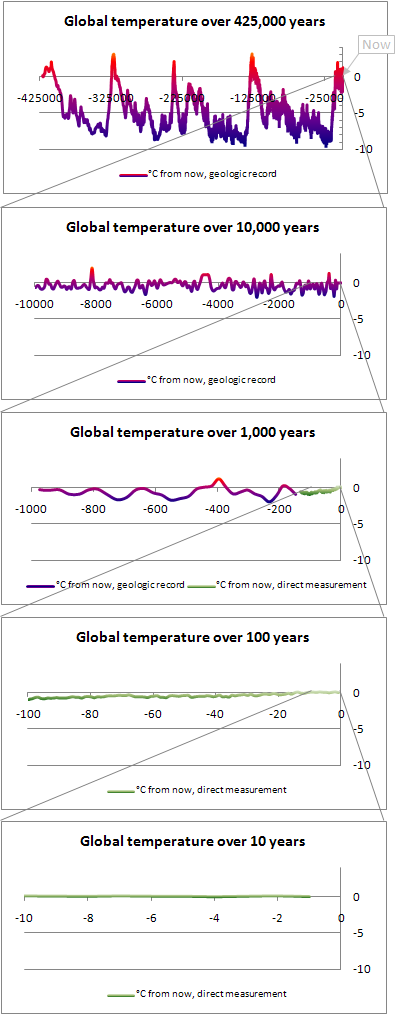
Funny how nobody wants to consider that we are, in fact, nearing the end of a periodic high in long term global temperatures. http://donath.org/Photos/TempChange.PNG
I think the data is significant as a record of what happened, but the greater conversation about climate change should continue even if the data showed record cold temperatures. Also of note is the Arctic oscillation http://en.wikipedia.org/wiki/Arctic_oscillation and as others mentioned La Niña. Washington state is interesting too as the normal trend of Pacific Northwest's somewhat temperate patterns were disrupted a little.
I wonder if people back then also ran around saying the sky is falling. It's not like the people in 1910 did anything to stop global warming. They continued industrialization worldwide and ended up on the other temperature maximum of the past 100 years. It's characteristic of any cyclic process.
Some would have you believe that we should have stopped burning fossil fuels in 1910 to avoid all the emissions over the next century. Did the gains of 100 years of machines outweigh the effect on climate? that's the question.
I can't imagine it does. To top it off, the numbers seem to be bounded to a very small integer interval. Even if the question was posed as a captcha, a computer could simply keep guessing. This is super-easy to brute force...
At least they enforce a moderation queue. (I asked about the standard deviation not being included as was mentioned by abtinf.)
edit: deleted parent post was discussing the plaintext captcha.
To the contrary, it was just forecast in a story I read earlier today, "Temperatures this summer are forecast to be about normal, and much cooler than the last two summers, says David Streit, a meteorologist at Commodity Weather Group expects.
"Sultry winters, he said, do not usually develop into sultry summers."
I'm just wondering how this article got pushed to the HN front page? If this were an article with substantial evidence against global warming such as the many articles and arguments provided in Crichton's State of Fear, would it be posted here? No. And that's my problem with this. The fact is that if we were actually capable of understanding what was causing global climate change, we would be able to predict the weather, and... we can't. We should instead be focusing on how we utilize our resources. That is something we can actually do something about. But don't try to provide statistical evidence of global warming just to "raise awareness" and prove that you are right. You'll never be able to do it. Focus on something that has a purpose. Tell people to go watch Medicine Man again, and maybe Sean Connery can convince them to stop cutting down rainforests. Do something freaking useful for once.
Good catch. "Predict the weather more than 10 days in advance", I should have said.
Prove to me what is causing global climate change. My point is that we cannot even predict the weather more than 10 days in advance, and even that is not totally reliable. Once we get to the point where we can reliably predict weather for years and years (say- more than a few thousand), then we can determine if we actually have substantial climate change, and maybe by then we'll know what really causes it. At this point, we are still guessing. We're using educated guesses, but they are based on possible coincidence.
>"Predict the weather more than 10 days in advance", I should have said.
That's false too. Predicting climate doesn't require predicting the weather. Compare: suppose you have a slightly biased coin - maybe 0.75 chance heads, 0.25 tails. I certainly can't predict the next throw, or the throw ten out - and without a hell of a lot more knowledge I'll never be able to. But I can be extremely good predicting the heads/tails ratio for sequences of throws in the future.
>Prove to me what is causing global climate change.
No, I can't do that, as I'm not an expert and this is a very complicated area. I suspect that nor are you. In such a situation, it's rational for us to defer to the body of expert opinion (although there are extremely interesting issues in decision theory and philosophy about how one should do so). Expert opinion is pretty unanimous about what is likely causing climate change, and there are no serious reasons to suppose bias. So let's defer to them.
>Expert opinion is pretty unanimous about what is likely causing climate change
Actually it isn't. I submit that most scientists do not believe in AGW. Want me to prove it? I can't. I submit that most glaciers are expanding, rather than retreating. Want me to prove it? I can't, and for the same reason.
There are an uncounted number of glaciers out there. Nobody has even counted them-- I meant that literally-- certainly nobody is doing a survey of a statistically significant number (a number we don't know because nobody has counted them, glaciers are really common) to determine whether they are expanding or contracting.
However, it is very common to hear from AGW proponents that glaciers are shrinking. Why? Because every chance they get, proponents of AGW, who are politicians, highlight glaciers shrinking. "There are no more snows of kilimanjaro" being a very famous example.
Same thing with scientists. Do you have a census of scientists? Have you surveyed them all? Can you provide me a statistically significant sample of the scientists who have looked into AGW and given a scientific argument on it one way or the other?
You can't. What you're doing here is repeating a political claim. A political claim that has the very convenient feature of excluding from any debate the very possibility of science.
Thus every AGW debate ends up being about politics and not science, because once someone tries to introduce some science, they are immediately shut down by AGW supporters asserting that all the scientists are unanimous.
Have you ever met a scientist? Find two scientists married to each other and they're not unanimous about anything. Hell, find an honest scientist by himself, and he isn't unanimous.
Ask 12 scientists for their theories on something and you'll get 18 theories.
The idea that scientific opinion is unanimous about AGW is really quite absurd, if you think about it.
FWIW, I can disprove AGW really easily. Mars is getting hotter. The IR absorption of CO2 is lower than water vapor. CO2 is a tiny fraction of the atmosphere. The planet is actually getting cooler since the solar maximum on the short end (despite CO2 going up) but getting warmer since the last ice age-- as it has always done. Mainstream perception of AGW is that there's some CO2 level that will result in runaway temperature increases-- this is historically false, as CO2 has, in the past, been vastly higher than it is today without any runaway effect. Pluto and Mars have been getting warmer exactly during the time of the rise in popularity of the AGW theory, they have no cars on them. (its the sun that is driving it.)
Did you know that the earth started out with a CO2 atmosphere with very little oxygen? The rise of algeal and plant life started converting that CO2 to oxygen and terraformed the planet into the oxygen atmosphere we have now.
BTW, CO2 tends to rise as the temperature rises, but unlike the graphs Al Gore showed in his movie (Which had been offset in time for "dramatic effect", this rise actually happens after the temperature increases.)
All of the above are basic scientific facts, many are not in dispute, though you can find lots of AGW propaganda sites "debunking" these "denier myths". (if AGW is so scientific, why the need to call people names?) I've followed hundreds of links to these blogs over the years, the vast majority assert they are "myths" and don't defend the assertion, a lot of them make up magical excuses (the most amusing was the claim that the effects of human created CO2 are different from naturally occurring CO2) ... and the ones that cite actual "peer reviewed research" almost always misrepresent it, or flat out lie about what the papers actually say.
They're pretty much completely relying on people giving up their hands and not doing any research and "believing the experts".
>there are no serious reasons to suppose bias.
Of course there are. The advocates of AGW are not scientists but politicians. And what are they pushing legislatively? The ability to control CO2. Since CO2 is produced by everything from beer and bread making to the very act of breathing, the power to control CO2 is the power over everybody. They have a vested interest in this control. The IPCC is a wing of the UN, the UN has been lobbying for years for the power to institute a global tax. A global tax on CO2 would go a long way towards making the UN a global government, which is what they want. Al Gore-- the primary spokesman for the movement in the USA-- is not a scientist, but does own a carbon credits trading firm and stands to make billions if Cap & Trade passes.
There have been numerous incidents of scientists being coerced into publishing results only if they conform to the AGW hypothesis. APL started refusing to publish any letters that questioned the issue-- tantamount to a rejection of science itself. And naturally, government funding goes to labs to prove AGW, not to objectively research the question.
I've worked in a national lab, including on a controversial question, and been thru the peer review process. The idea that there's no bias is silly. Even in non-controversial things, there's always bias. Peer review is often about not stepping on the toes of someone whose long held theory is undermined by your results.
Science involves bias at every level all the time.
This article has very very little to do with climate change and a lot more to do with local climate, or weather, as it is talking about the temperature of North America, which is not the global climate.
As for claiming that understanding of a variable at one scale requires the prediction of other variables at smaller scales in the same system, consider signal to noise.
What this article is saying is that the US is very hot, early in the year. Somewhere else might be very cold right now. Or it might not, this article does not say either way.
But of course more comprehensive data like that isn't quite as attractive.
(I still think the record US March counts more as evidence for global warming than against it. But it's not nearly as strong of evidence as some people wish it to be.)
[1]http://reason.com/blog/2012/04/04/global-temperature-trend-u...