The problem with these indicators is that, although they may indicate over- or undervaluation, they tell you nothing about when a mean reversion will happen.
As Keynes famously said: "The market can stay irrational longer than you can stay solvent."
An indicator that does a pretty good job of signaling the "when" of a recession, and by extension the likely "when" of large market corrections, is yield curve inversion. It predicted the recession of early 2020 quite well, even with the external shock of the pandemic.
From the perspective that somehow a reset of the business cycle has happened through government transfers (not exactly a sound assumption), watch interest rates, and in particular the relationship between the 2 and 10 year.
Should we start to see a rise in short-term rates, without a similar rise in long rates, watch out. You'll no doubt see a multitude of articles explaining how "this time is different." It won't be. And on top of all of that, we'll head into it with the most overvalued market in history.
Fed Fund Rate vs 30YT since 1970(only cherry picking this year because the data on fred is poor before this period, and end of gold standard is significant) is a perfect 8/8[0].
And how many degrees of freedom went into the choice of metrics to compare? Just because something went 8/8 doesn't mean it will predict the future crashes.
I'm not super knowledgeable in this area, but one possibility is that the "9 of the 5" only gives the number of times that it predicted that there would be a recession. There could be many more times that it accurately predicted that there would not be a recession.
So you are saying that a plausible mechanism leads to a ~50% prediction accuracy?
I'm curious how this stacks up to the accuracy of other prediction methods? Off the cuff, this one doesn't seem too bad. esp given the stochastic nature of the variable being predicted.
This "9 out of the last 5" quote is the deadest of beaten horses on HN. It shows up at least once a week here, and it is written with such smugness and unoriginality that it makes even dad jokes funny by comparison.
Let's cut to the chase and make a bot that posts "9 out of the last 5 recessions, hyuk!" on every post remotely related to finance and be done with it. It is the furthest thing from a substantive comment; it is a recycled low-effort joke in the style of reddit.
I agree that it's amusing the first time one reads it. But it is posted here a lot and has become very trite; it probably competes with Hanlon's razor in terms of frequency. After just a cursory search, here are some other examples:
It's not an indicator problem, it's a problem of people trying to time markets. Also, there are two ways to use the Buffet Indicator - right and wrong. The wrong way is to say 'it's overvalued, I should do something - short the market'. The right way is 'it's overvalues, I should avoid doing something - buying overvalued stocks'.
Buffett has been sitting on piles of cash in the past for years and years, avoiding buying securities when they are overvalued. He never tried timing the market, simply waiting for the right moment. Nor did he sell stocks when they were overvalued in order to try to buy them back at a lower cost at least AFAIK from reading his biographies. So, for a value investor, it's a useful tool.
> sitting on piles of cash in the past for years and years, avoiding buying securities when they are overvalued. He never tried timing the market, simply waiting for the right moment.
It’s not quite clear what you’re trying to say here, because if you popped into a newbie investment forum and said you were sitting on a pile of cash that you were avoiding investing because the market was overvalued, you’d be told that is the literal classic “trying to time the market” move.
Buffett obviously is a sophisticated investor who knows what he’s doing but if your description is right this is absolutely still him timing the market. Timing the market isn’t just when you try to pick the day that’s lowest, it’s still timing the market if you are picking the month or year that is lowest.
One note about idolising Buffet in modern times is that it seems to me any strategy Buffet used to employ is outdated.
Any simple metrics, or indicators you can think of are already priced in by algorithms so the only possibility to gain an edge would be to have some very specific niche knowledge or inside information, or you must have even better algorithm that considers more variables.
Any success not stemming from those things can't really be attributed to anything else than luck.
I'd argue, Buffet even if young, couldn't do the same today, that he did in the past.
If there's a successful pattern discovered it will be used until there won't be any more profits available from being able to read this pattern. And these patterns get more and more complicated as time goes on, for an hobbyist investor there's absolutely no way, to do some technical analysis and find a profitable idea.
The denizens of the investor forum would be wrong; it isn't trying to time the market. This strategy is simply valuing the stocks.
The problem with the plan is that holding piles of cash is a game for losers; you need the money to be in some sort of asset - it matters not what - to avoid the printers of the central banks. There is a real chance that stock prices never come down as much as everything else goes up.
As a sole investor you can't in modern day value stocks more accurately than their current market cap.
Any difference in valuation you come up with compared to the market cap would simply mean that there's something missing in your calculations that makes up the difference, as the stock and its market cap is coming from thousands of times more complicated methods for valuing the stock than whatever few metrics you were able to consider.
Essentially by using some sort of method to value a stock, you can only fool yourself to think that you know what you are doing and are skilled beyond luck. Because you are competing against institutions with state of the art tools, researchers and experience.
> Any difference in valuation you come up with compared to the market cap would simply mean that there's something missing in your calculations that makes up the difference
Not necessarily, can also mean that your circumstances are different from the large traders. Value is relative to your net worth, status RE the tax system, risk tolerance and current allocation. So it is not only possible but likely that the large traders have a valuation that is correct for them and wrong for you as a small market participant.
Besides, if all assets are - in some sense - equal then any inane strategy that involves buying assets is equivalent to any other and just dumping all the cash into any basket of assets is workable. So people could probably buy just assets they like and expect an equivalent return to everyone else. If that logic holds.
> people could probably buy just assets they like and expect an equivalent return to everyone else
That's pretty much true. Although risk and volatility does differ from asset to asset. So as a lone investor you can decide how much you are willing to risk to get better returns.
I firmly believe that you should just invest on a fixed schedule. Every month, every year, whatever. And if you see a significant drawdown in between those periods you can buy in before the next scheduled buying time.
But never get scared from investing when stocks are too high - this strategy works one way because you should always be long the market.
> The denizens of the investor forum would be wrong; it isn't trying to time the market. This strategy is simply valuing the stocks.
trying to pick the stocks that are least overvalued is great and everyone should be doing it all the time. (assuming you are investing in individual stocks and not index funds)
the problem comes when you say "everything is overvalued so i'll sit in cash until the market is less overvalued" and yes that's timing the market.
> The problem with the plan is that holding piles of cash is a game for losers; you need the money to be in some sort of asset - it matters not what - to avoid the printers of the central banks. There is a real chance that stock prices never come down as much as everything else goes up.
yes, you've identified the central problem with timing the market, this is precisely why it's a bad idea in general.
As others are saying: if you accept the efficient market hypothesis then your guesses are inherently no better than random chance, unless you somehow have unique insight that nobody else in the market has. Otherwise if you've successfully identified a trading strategy that worked, it would be exploited until there was no longer any value there, and the market returns to "no better than random chance".
(there's the old joke: an economist and his friend are walking down the sidewalk. The friend spots a bill laying on the ground and says "look, a hundred dollar bill!" and bends down to pick it up. But the economist keeps walking, saying "of course it can't be, if it was then somebody would have picked it up already." It's a meme but in a macro sense it's true, there are small pockets of alpha that can be exploited on a small scale but in the macro sense the market is as efficient as it can be and everybody else is just as aware as you that "the market seems overvalued right now" too.)
Therefore the best strategy is to dollar-cost-average across some span of time and accept that you may have missed a percent here or there but that the market is generally going up by more than you missed - and that you also may have timed it poorly and cost yourself a percent or two as well.
Timing the market means you are predicting when something is going to happen, ie, has elements of time involved.
Valuing an asset and then not buying when it is expensive is a completely different activity. It involves no prediction on how long it will be before the price corrects relative to value.
> He never tried timing the market, simply waiting for the right moment.
That's the same thing. Whether you are staying out or buying in, both are trying to time markets. Avoiding doing something is also an action.
In fact historically by staying out because you think something is overvalued has been shown to be outperformed by constantly putting in to the market whatever you can.
Another way to think about this is that historically equity returns are so consistently high that even with an accurate predictor of returns it’s not worth not being exposed to stocks.
Even if you know the next ten years will be in the bottom decile of returns for the S&P 500, you’re still better off than with cash.
"Suppose I offer you a security that will pay $100 two days from today. You can buy as much of it as you like today at $50, or you can wait until tomorrow. Tomorrow, I’ll flip a coin. If it’s heads, I’ll sell you the security at $99. If it’s tails, I’ll sell you the security at $25. What should you do?
Clearly, if you buy the security today, you’ll double your money two days from now. That’s a 100% expected return for each dollar you invest, over that 2-day period. If you wait, you’ll earn nothing on the first day, but you’ll then have two possibilities. If heads, you’ll get just 1% on your invested money. If tails, you’ll get a 300% return, quadrupling your money. With a 50/50 chance at each, your expected return for every dollar you invest is 0.51% + 0.5300% = 150.5%. So waiting adds 50.5% to your expected return over that 2-day period."
Keynes also said “in the long run, we’re all dead”. But with these popular quips, Keynes wasn’t undermining macroeconomic theory, but certainly is communicating that policy outcomes are civilisational in both scale and timeframe.
Neither politicians, nor your investment advisor, use such a scoped time horizon.
But as the sibling comment and all the sources above say, those do not predict the path, only the destination (which is a decade or more in the future). It would be completely consistent with such macro valuation models if, for example, the general prices doubled or even quadrupled over the next year or two, why not. Stay safe out there :)
These indicators are far more interesting and useful than crash/recession predictions. Being so highly correlated with subsequent market returns makes your choice simpler - you don't need to predict the crash, instead you can simply see your estimated returns in the next decade (currently negative). Whether the crash comes tomorrow or in 5 years is meaningless.
As long as interest rates are essentially <=0, no coefficient or ratio which does not take that into account is useful.
Breaking the concept of money as value in time (and that is what the ineterest rate means, because value now is better than value later) has broken all the basics of economics and finance. And is totally distorting.
It is a huge shame which central bankers somehow will have to pay for.
Edit: just to explain. "Value now" is better than "value later" or otherwise actions are generally worthless, which is a somewhat negative philosophical foundation for "Economy" which comes from "household management"...
I agree with this. Apple, a huge part of spy, does tens of billions of business outside the US. Most of the rest of the S&P 500 also. Using US GDP as a denominator is faulty when the stocks in the numerator are worldwide leaders. It’s a simplistic measure that I wouldn’t base my investments on.
I'd think this and everything Buffet used to do is obviously outdated. Any simplistic indicator or metric won't be more accurate than what a current market cap for the company is as financial companies, with state of the art tools, researchers and experience can determine what is accurate with far more efficiency than Buffet or any simple metric ever could. If they realise there's inaccuracy in a market cap somewhere, and there's reason to believe that the market cap will change in some direction, they will take the profit from it until there's nothing to take and market cap will be accurate again according to their calculations. Even if in some cases they might be wrong, they will be more accurate in the long run as any usual metric due to law of large numbers. Essentially when trying to use any indicators or metrics here you are playing poker against people who have far more information about the cards compared to what you have.
I think this is the biggest factor - the rise of the "Buffett Indicator" implies that the stock market is increasingly valuable compared to US GDP, and thus capturing or measuring more value than just US production, but the linear expectation suggests a constant rate of globalization, with no justification.
I thought for sure we were headed for a recession prior to covid based on this. The great thing about being a permabear is that eventually you are right. In the meantime you're a terrible investor who can't afford to buy a house. And then when your predictions are fulfilled, the prize for winning is everything going to crap in the world
The problem with macro-economic composites is that at that level, everything is unfolding on different timescales. So around transitional moments, your end result is going to go wonky.
GDP plummets -> interest rates are dropped -> GDP recovers -> interest rates are raised
You're balancing between responsiveness, accuracy, and reliability: pick two.
I'd have thought the last few crises would have taught us that we should be thinking about the system more in terms of stability, or lack thereof.
The housing crisis could have not exploded, if key institutions and/or investors had acted differently. But it was objectively true that the entire system was in a very unstable state.
I'm increasingly of the opinion that control theory is the right framework to apply here.
The very existence of business cycles suggests that the economy has "underdamped poles", and perhaps a more forward-looking central bank policy could add enough phase margin to damp them and prevent recessions altogether. But it would require always taking one's foot off the gas pedal before conditions really seem good enough.
Not OP, but I imagine it's something like "precision" vs. "how often correct." So you can be extremely precise quickly, but not all the time. Or you can be extremely precise all the time, but not in time to make good decisions. Et al.
Maybe inflation is not hitting these at the same pace?
The money supply has been increasing for already some time, but only now we are seeing inflation catching up for example on consumer prices.
For money supply to show in consumer/business side of GDP, money created by central bank need to be distributed. When interest rates have been low, maybe banks were hesitant to start pushing money to individuals and businesses and it instead ended up in stock market.
There's just one more step; the market's value is an expectation of the future while the GDP is a 'now' metric. So while inflation is auto-adjusted (roughly) in the past, a strong expectation of inflation now can send the market cap up (and either GDP will catch up, be it natural or on inflated dollar terms) or the market will crash, or some combination of the two to bring the indicator back to earth.
I don't think that's correct. Stocks suffer with inflation. Interest rates rise and money moves to bonds. Credit is costlier and profits fall. Both weigh on stock prices.
Historically stocks perform poorly in times of high inflation.
The central bank performing a duration swap on money already in the economy does not involve printing anything. They’d like you to think it does though as fear of inflation stokes the behaviour they want.
Related to all of this, note, we may see in the not too distant future "deeply negative" interest rates. Currently, it is difficult to go much below zero because you can stash physical bank notes under your mattress and get a better rate of return (0% instead of -1). But in a cryptocurrency future, the mattress is not an option enabling central banks to go deeply negative (e.g., -5%). I just read a fascinating article in the WSJ about this topic: https://www.wsj.com/articles/digital-currencies-pave-way-for...
You can actually create negative interest paper bank notes without needing cryptocurrency. One example is stamp scrip, where one must pay a recurring fee to maintain the note's validity:
I would just like to point out the fact that the S&P 500 is almost four times higher capitalized than it was a decade ago. There are three obvious reasons for this that come to my mind:
* There has been massive asset inflation.
* The market is in a speculative bubble.
* The 500 largest American companies really are ~4 times more valuable than they were 10 years ago.
Even with #3, the best case scenario, that alone should be setting off major alarm bells, because their material contribution to society hasn't increased fourfold, so that increased valuation must be coming from somewhere, that is to say, control over society more generally.
(I have said this above, though): if money today is worth less than money tomorrow, you want to get rid of it as fast as you can. People want to "save", anyway. This implies that the only way to save money is to invest it in risky assets. There is no point in buying bonds as investment for the general investor (only for hedging) if they will be worth less tomorrow than today -you are burning money, literally.
Does this not look very much like inflation? (i.e. if you do not spend your money _right now_ you may not be able to buy anything tomorrow)..... It is inflation but Central Bankers do not want to see it.
Just a reminder that a larger portion of today's market value is made up from Tech stocks. Tech stocks are typically higher valuations and P/E multiples, giving a skewed data point perspective vs. 20 years ago.
I see Cisco with a few years of 15% net income profit margin from 1998 to 2000 (they do not have any reports before that on their website). And Ericcson is in the single digit ranges around 7%. Cisco actually got more profitable and since at least 2006 has been in the 20% range.
Apple has been in 20%+ range for over a decade, Alphabet in the 25% range, Microsoft is hitting 30% regularly, and Facebook is at nearly 40% for the last 5 years.
For Amazon, I can only assume investors are factoring in huge profit margins for AWS since it seems to be singlehandedly marching Amazon’s profit margins from near 0% to 6% in the last 6 or 7 years.
Feels like a different level of profit than in previous decades.
So you are arguing that the market is overvalued -- because tech stocks are overvalued? Makes sense, perhaps the apparent overvalue is simply because of companies like Uber and Tesla.
At the end of the day, stocks are worth whatever people pay for them. It is a fact that tech stocks do have higher P/E multiples at this moment in time. The important question for investors is whether those multiples mean that the stocks are overvalued... or whether they deserve it. The market will decide that, and the answer may change drastically just like any other set of stocks.
On the other hand it is not likely that interest rates will remain this low for very long. How much money can be poured into 30 year bonds with less than a 2% coupon rate? How long will the Fed continue its asset purchase program? How much more supply can be added to the bond market before demand begins to run out? One way or another interest rates will begin to rise, and then the stock market will be forced to correct.
We have had a 40 year bull market in bonds, but that is almost certainly coming to an end. There is just no more room for that bull to run.
They don't cover the % of revenue derived from overseas. Ie the GDP of the US is less meaningful over time for the S&P 500. It really should show total market cap / GDP of relevant jurisdictions weighted.
No matter what mechanism is used, investing comes down to putting money into a instrument to get a reasonable level of return given the risk taken. Passive investment strategies don't change this fundamental equation; they just hide the mechanics from the investor.
The $64 questions in today's economy are:
1. Will multiple expansion continue indefinitely, thereby enabling investors to achieve higher profits than one would expect via fundamentals alone (GDP growth, profit margins, tax rates)?
2. Is the risk in the index really so low that it makes it worth an investment, even if the return absent multiple growth is something like 3-4% a year nominal?
3. When risks do emerge, can the federal government indefinitely reward investors with lower discount rates without triggering any negative consequences?
None of these is directly tied to passive investment. In fact, I'd argue the fact that investors no longer actively track what's going on in indexed portfolios creates a benign neglect situation that is contributing to the current bubble and the risk of collapse.
My biggest concern here is that the bubble is so large that, if it collapses and the government stops being able to print money to "correct" that, even those with marketable skills and decent savings won't be able to escape the undertow of the recession/depression that follows.
#2 depends on time horizon. Getting 3% above inflation is better than losing ~2% per year to inflation. With the former, over 30 years, you're doubling your purchasing power.
Over 30 years you'd be very surprised and unlucky not to make a positive return with a globally diversified stock portfolio
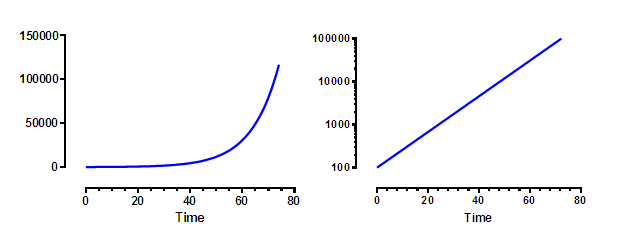
All dollar-denominated graphs in the article use linear scales, which is misleading, because price inflation is compounded (exponential). Compare the difference in how steady inflation looks between linear (left) and logarithmic (right) here:
This is not to dismiss the fact stock market valuations are outstripping growth of the economy, but the article is definitely making it look even worse than it is.
This indicator is sensitive to a number of financial factors, including corporate capital structure (higher if companies finance with equity over debt) and IPO rates (higher if companies go public faster than public companies fail or go private). Given both those have been highly variable in recent years, I’d argue this measure has receded in value as a metric.
I respect Buffet Indicator but small and medium sized businesses are not part of US stock market so it is somewhat irrelevant to compare GDP to Stock Market Value if you do not include approximated valuation of small and medium sized businesses.
The heuristic that market crashes every ~9 years seems to work well. 2020 had a pretty steep correction, so I will wait another 7 years and start worrying. That might not be optimal, but 70% of the time you can predict the weather by saying it will be the same as yesterday.
As Keynes famously said: "The market can stay irrational longer than you can stay solvent."
An indicator that does a pretty good job of signaling the "when" of a recession, and by extension the likely "when" of large market corrections, is yield curve inversion. It predicted the recession of early 2020 quite well, even with the external shock of the pandemic.
https://www.forbes.com/sites/leonlabrecque/2020/02/26/anothe...
From the perspective that somehow a reset of the business cycle has happened through government transfers (not exactly a sound assumption), watch interest rates, and in particular the relationship between the 2 and 10 year.
Should we start to see a rise in short-term rates, without a similar rise in long rates, watch out. You'll no doubt see a multitude of articles explaining how "this time is different." It won't be. And on top of all of that, we'll head into it with the most overvalued market in history.