This seems to ultimately come down to an idea that folks have a hard time shaking. It is entirely possible that you cannot recover the original signal using machine learning. This is, fundamentally, what separates this field from digital sampling.
And this is not unique to machine learning, per se. https://fivethirtyeight.com/features/trump-noncitizen-voters... has a great widget that shows that as you get more data, you do not necessarily decrease inherent noise. In fact, it stays very constant. (Granted, this is in large because machine learning has most of its roots in statistics.)
More explicitly, with ML, you are building probabilistic models. This is contrasted to most models folks are used to which are analytic models. That is, you run the calculations for an object moving across the field, and you get something within the measurement bounds that you expected. With a probabilistic model, you get something that is within the bounds of being in line with previous data you have collected.
(None of this is to say this is a bad article. Just a bias to keep in mind as you are reading it. Hopefully, it helps you challenge it.)
If it helps anyone, the FiveThirtyEight article describes a scenario where people take a survey about immigration status and voting. Most legal citizens will correctly identify themselves, but some will accidentally check the wrong box and say they are an illegal immigrant. If you have a billion citizens and 10 illegal immigrants truly taking the survey, and people check the wrong box 1 in 1000 times, your "percentage of illegal immigrants who vote" statistic will be about the same as for citizens (because almost all reported illegals will be citizens). Collecting more data won't help.
It's a very good article, though in the context of deciding how many variables should be in a model of some complex phenomenon, this example is a little tougher to wrap your head around. It's not quite a predictive model, but there were some variables left out. A naive model I suppose is "this data is generated by infallible respondents", whereas a better model would incorporate that error rate. There isn't as much of a question about which pieces of information are relevant, though, like you might encounter when trying to predict future drug use from household income, race, age, number of books read as a child, number of pets, and so on.
The other common example of the same phenomena is a test for a deadly genetic defect with a 1% false positive rate. If the incidence of the defect is .01% and you test positive, its actually more likely that you don't have the disease. (although this can be solved with bayesianism over frequentism).
That's incredibly unnecessary. My understanding of statistics is not derived from comics (and the first time I heard that example was in a statistics course), and the link you post doesn't actually address what I stated. It addresses an actual mistake in the comic, which is a mistake that I didn't make.
Here's Andrew, the author of that blog post:
> Yes, I think it makes a lot of sense to criticize particular frequentist or Bayesian methods rather than to criticize freq or Bayes statisticians.
Which is exactly what I did. There are times when frequentist methods are effective. I just wouldn't use them to tell me that I have a disease.
I think the key point is that in the case of sampling, you always assume that your signal has finite bandwidth, so you can claim to avoid aliasing so long as you sample suitably often. Further, the time duration over which one makes measurements puts a cutoff on the frequency resolution. Both of these essentially serve the purpose of implicit model regularization (aka bias).
For sufficiently well-behaved signals, the estimator of the strength of various frequency components (i.e. the Fourier transform) is pretty stable as one enlarges the window of measurement, which is post-hoc validation that the signal is well-behaved.
This might not be true for very weird signals, and enlarging the window of measurement might significantly change model parameters--meaning that one might need a non-parametric model to get by (enlarging number of parameters with number of measurements) rather than restricting to a finite number of frequency models. Eg: Suppose the first 100 measurements show a nice sinusoid of some frequency, but the next 100 measurements show a pretty much flat signal. Then, you are forced to revise downward the parameter corresponding to the importance of the sinusoid component, and increase the importance of the zero frequency component. The thing is, one never truly knows how the signal is going to behave in the future. Any parametric model is a bias that things won't get too complicated.
These are concepts I believe are very important to internalize if you work with machine learning. Fundamentally we are making predictions (ie. guessing) on the nature of entirely unknown information. So there is a certain inherent impossibility to the task in the general sense. It shouldn't always work.
The irreducible error is unrelated to the bias/variance trade-off. It's part of the overall error of course, but the bias/variance error is in addition to that. Unless I am misunderstanding your point.
Sorry, I did not mean to be that they were the same. And, to that point, I was greatly projecting based on my beliefs that have grown. The number one thing I keep having to re-stress and learn is that these are probabilistic models.
So, if anything, I only meant they were related in that they are both good targets to internalize when working with ML. If there are better targets, I'm definitely interested in learning more.
Ultimately, everything is a probabilistic model. It'd be ridiculously impractical to try to incorporate all of one's knowledge into an analytic model. Instead, we generalize as appropriate and encapsulate the rest as a random variable, sometimes called "error". Plus, God plays dice and all that.
The whole problem of overfitting or underfitting exists because you're not trying to understand the underlying model, but you're trying to "cheat" by inventing some formula that happens to work in most cases.
That's is a great and pithy characterization. To expand on that a little:
If there existed an underlying model with a finite number of parameters, then you could potentially find it will a finite number of measurements. But if there is no underlying model, the only viable approach is using non-parametric estimation. If you try to truncate a non-parametric model to a finite/fixed dimensional model, you are introducing a strong source of bias. (the "bias" of assuming that there actually exists a not-crazily-complicated underlying model)
Yes, interestingly the idea of preference for simplicity is a medieval invention - not a universal truth. It served the rational program well for eight hundred years, but now we have infernal engines we can abandon it. I think that the late enlightenment test of theories that generate a clutch of non trivial testable predictions is going to prove more useful in the future.
There are many reasons to prefer simplicity, not just that prior to ubiquitous computing
complicated models were intractable.
Off the top of my head:
A simple model can be "robust" to errors because the errors tend to cancel out.
More complex models are typically more sensitive to slight changes in the input (and therefore noise), so even if your model is exactly correct, small errors in the input can be amplified yielding large errors in the predictions.
Or it can be preferable because it tends to fail in certain characteristic ways.
For example, Newtonian mechanics breaks down at both the high and low mass/energy scales, but it's usually possible to determine whether you'll have to employ GR or QM (and perhaps despair if both are required simultaneously).
Also, it's much easier to test simple models (and typically also to train them if we're talking ML)[0].
Furthermore, if your first approximation is well-understood, then you can complicate it to address new data.
Simplicity has many virtues; just because we can employ more complicated methods now doesn't mean that we should, or that the sole reason previous generations of scholars opted for simple models is because they couldn't perform the calculations needed by more complex ones.
In general we can't expect to know the underlying truth with certainty, but maybe a question is so important and so well investigated that it merits a seriously convoluted answer.
For less well-studied or relatively unimportant problems, a model that is obviously wrong but easy to use is usually preferable.
It's called the bias-variance trade-off for a reason (although you should still try to get a good deal, which in this case means minimizing error or perhaps risk).
------
0. This point can be particularly subtle-- we generally have more computing power available than (quality) data.
I can try millions of variations on a given hypothesis for a small data set relatively quickly and find a handful of results with publishable p-values.
This is how you get replication crises.
Even if one of my hypotheses is invalidated, I can generate many more that are still consistent with the data.
Take string theory for example-- a naive approach to testing the various parameterizations/permutations of the basic idea would run out of time before the heat death of the universe, so absent theoretical work constraining the possibility space, it would be effectively unfalsifiable.
I don't have ML or deep learning background, but I second what you said base on my experience with backtesting trading systems. We will collect market data and design algorithms that seem to produce the kind of outcomes we want. Then test on some other data sets which the algorithms have never been applied on. Many iterations later, you can get a decent profitable algorithm. And if the 'holy grail' algo is run in market long enough, eventually there will be severe drawdown and going bust. The quality of the algo and I assume the deep learning model lies in the quality (breadth and depth) of the data, and how honest with himself the person choose to model it. There will be time and again new 'black swan' or edge events happening (remember LTCM), because using machine learning is like using the past to predict the future.
I guess as long as the users' expectations are correct it can be useful in some very specific areas. Referencing the AlphaGo game last year, I was a Go player for more than a decade. But yet AlphaGo's weird move inspires new insights that break the conventional structure / thinking-framework of a Go player. From that angle, I do think that even though DL is somewhat a blackbox, humans can pick up new insights because it explores areas which are normally ridiculous to a human with 'common sense' to explore.
trading systems are very difficult to model because there are more variable than you can imagine. So basically you are creating a model with less information from the domain than you rather need. But this is not the case in all domain.
With AlphaGo there are several things you have to consider. It is not only using deep learning it also uses monte carlo tree search, basically this algorithms is good at exploring search spaces like games. But the key factor in AlphaGo was deep learning evaluating the states.
What I want to say is that neural networks are not meant to explore but to discover patterns. It is something very different. They are very interesting because they work as our brains (discovering and fulfilling patterns), but they as bad in searching as us.
For the branch of trading technical analysis which assumes that all information is factored into price and price action, the variables will drastically be reduced probably to something like volume, low, high, open, close etc. That makes it ideal to develop algos. But as the fundamentalists would say, assuming that everything (demand from insider news etc) has been factored into price is an overly simplistic way of looking at markets.
I see.. Thanks for sharing. I assume you mean evaluating game board states, finding valuations objectively and figuring out the pattern of where to move that can lead to higher probability of winning? 20 years ago I made an Othello game that use a search tree (I think configurable from 3 to 9 levels deep), assign valuations to different board positions and let the computer assume that the player would make the best move to his advantage. It turns out can beat human players easily, but that is such a small search space and valuation weights are very clear. Thus I was amazed at the computer winning with such a large game board where even for professional players, it is arguable which state is a better state. EDIT - ok I just googled monte carlo tree search, I must have accidentally implemented that search at that time, base on common sense and what I can do with the programming langauge I had at that time (Visual Basic).
I find very interesting how some trade algorithms are using deep learning to extract features form news apart from the variables you mentioned.
About the search, in case you are interested. You have the basic tree search, then you have A* (a-start) which uses an heuristic to decide which is the next node to expand (very used in path finding in games, where the heuristic is the euclidean distance to the target point). For games you use a search where in one state you maximize the heuristic (your move) and in the next one you minimize it (your opponent move) (sorry I don't remember the name). And monte carlo tree search what it does is to no evaluate some states, it just do some random moves and evaluates the final state, this way it tries to improve the exploration/exploitation of the search (and works pretty well).
> For the branch of trading technical analysis which assumes that all information is factored into price and price action, the variables will drastically be reduced probably to something like volume, low, high, open, close etc.
I'd call that quantitative analysis, not technical analysis. The difference between them being the difference between astronomy and astrology. Technical analysis refers to classic trading strategies of visual patterns in the price charts like double top or bottom, head and shoulders, etc; these patterns and their traders suffer from massive hindsight bias. Feeding prices into computers looking for patterns is not technical analysis unless you've programmed the computer to look for said human found patterns. If the computer is actually searching for real patterns and you're testing them properly with forward tests on fresh data, you're doing quantitative analysis not technical analysis.
TA is practiced by manual traders, Quants are generally automated traders or traders doing proper statistics rather than relying on the visual patterns manual traders think they see.
I also think that, even if all the information is efficiently baked into price, price isn't the predictor - the information doing the baking is. If you use the "predictant" as the predictor, you won't get very good results.
Not to say that people don't, but as mentioned, they don't last. How long they do last is an even more difficult prediction problem.
In a sense Data Science is like the Cult of the MBA. MBAs believe a trained manager can manage anything because management skills are generic. A data scientist believes they can analyse anything because analysis is generic. Both fail in the real world because they discount domain knowledge.
Is there a field that does not discount domain knowledge? Or is that just "judgment" and custom analysis? I am trying to understand how all fields map together. Thank you.
The divisions are very confused. I think that sensible people all wish to use domain knowledge if possible. There are two tiers of this, firstly the use of domain knowledge in the manual or procedural construction of the insight system. Secondly the use of formalised knowledge in the creation of models that can then be fused with data.
The first case is where data science has got a bad name; people swing into domains and companies full of cocksure ideas, produce insights that are risible or obvious and get ejected. Sometimes it takes years for sufficient knowledge to be acquired by analysts to deal with difficult domains.
Lots of people use Bayesian inference to do the second. Tools like Stan and PyMC3 are really popular and effective.
I simply don't recognise that characterisation of ML. I think that "data driven AI" fits far better. ML emerged in a number of ways over the years, but a strong driver of the last iteration was the knowledge engineering bottleneck encountered in fifth generation computing and surrounding the demise of the last turing center.
I invite you to read Chris Bishop's or Stephen Muggleton's books.
Anyone who works with data will find it hard to imagine data that "fell into your lap", all the data I've ever used successfully required slogging and grinding.
data that "fell into your lap" is a euphemism for a process in which the data was not generated by a controlled experiment in which a hypothesis is created first, and then the data is gathered according to a procedure using the proper controls and testing.
"fell into your lap" has nothing to do with how hard the work is, it's about the difference between a controlled experiment and an observational study. the bulk of ML is observational in nature (focusing on prediction) and therefore has nothing to say about causation or understanding the causal variables of the underlying reality.
Yes, it's observational data. But this is quite common in many sciences. Observations of stella events, measurements of ecosystems and weather events for example. These have lead to theories with explanatory power and machine learning tools can and do as well.
Wow, the discussion on the Fukushima civil engineering decision was pretty interesting. However, I find it surprising that the engineers simply overlooked the linearity of the law and used a nonlinear model. I wonder if there were any economic / other incentives at play, and the model shown was just used to justify the decision?
You should never, ever extrapolate. It doesn't matter what your model is, it won't work.
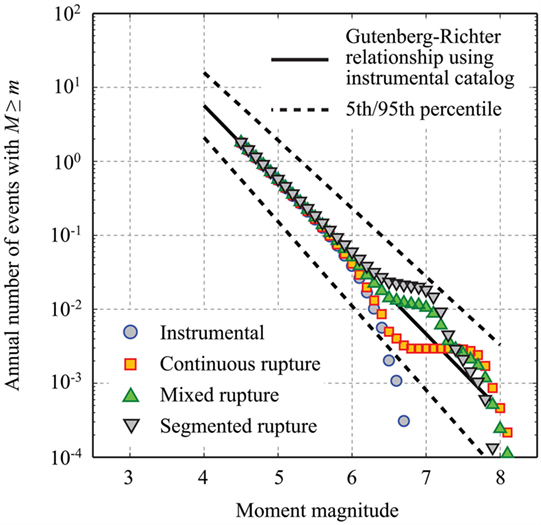
On a side note, it could be that there is a breakpoint at Magnitude 7.25, where the slope of the line really changes, and a segmented linear regression is appropriate (https://en.wikipedia.org/wiki/Segmented_regression). But we would need more data to be sure, anyway.
Not extrapolating isn't really an option in cases like this. You have to give some prediction for earthquakes of magnitude 9. Ultimately you must make a decision on whether to design for such an event.
But a sensible thing to do would be to draw many samples from the posterior distribution, instead of just using the maximum likelyhood estimate. That way the prediction accurately represents the uncertainty resulting from not having any data above magnitude 8 as well as, perhaps, your background knowledge that earthquakes of magnitude 15 never happen.
In retrospect they should have calculated both intercepts and taken the more pessimistic one. It's surprising they did not. However this could've been a decision based on the cost. Still weird that wasn't explicitly called out. Maybe it was.
Most likely, since building a facility to survive a 2.5x stronger shake would surely be a lot more expensive.
I was also curious about how the data in the past few years did not follow the same trend as before. Does anyone know if that is what geologists call to be 'overdue' to an earthquake? Like California is supposed to be for a while?
Well, the data wasn't showing that the past few years were anomalous; rather, there were fewer high-magnitude earthquakes than expected. I don't think this has anything to do with being overdue for an earthquake. Most likely this is just because with events of low frequency (e.g. these higher-magnitude earthquakes were predicted to occur once every ~100 years by the linear model), large percent deviations from the expected value are more probable. Basically if you flip a coin 10 times you might imagine that 3 heads and 7 tails is pretty common, whereas 300 heads and 700 tails on 1000 tosses is comparitively extremely unlikely.
My point was that maybe for high mag quakes the power law is invalid... Or at least I dont think we have enough data at this end to be certain of what is going on.
Here's another plot, this time from UK seismic frequency, where again the frequency for high magnitude earthquakes seem 'under' the expected curve. Yet, again, these are 2 plots...
Actually it seems so. I'm no geologist but a quick google search for Gutenberg–Richter plots show that this 'kink' can have a very specific physical reason:
Honestly, the nonlinear model looks far better to my eye than the linear model. The error term of the linear model seems obviously dependent on X, which contradicts the notion that the linear model was "correct". I think the article does a disservice to the reader by oversimplifying and calling the linear model "correct".
As therajiv pointed out, there were only a handful of data points supporting the kink in the curve, down at its end, versus lots and lots for the main line. Even in freshman physics labs you get told it's a terrible idea to extrapolate from a few points at the end of a curve, because those are typically the noisiest.
I would like to believe that the engineers working on building a nuclear reactor were not so easily fooled by an over-fitting problem; if that were the case, wouldn't that mean we now have actionable information on whether other nuclear power plants are designed correctly?
it is interesting for sure - but, I have to point out that the containment systems actually did survive the quake. They didn't adequately plan for the tsunami. There may have been no distinction in the analysis, but I wouldn't infer that surviving the quake, and the survival of a potential tsunami were the same piece of analysis.
That's OK as a visualisation of what bias and variance are, but it's a bad visualisation of the bias-variance tradeoff, because in that image there is no tradeoff - it shows a case where bias and variance are independent of one another. An illustration like this one genuinely confused me when I was first introduced to bias and variance: I couldn't understand why the lecturer was claiming there is a tradeoff while showing a picture of a case where there is no tradeoff. I eventually figured out what was going on, but I think I would have got it quicker if it had been explained more like the linked post, and less like that diagram.
One good way to solve the bias-variance problem is to use Gaussian processes (GPs). With GPs you build a probabilistic model of the covariance structure of your data. Locally complex, high variance models produce poor objective scores, so hyperparameter optimization favors "simpler" models.
Even better, you can put priors on the parameters of your model and give it the full Bayesian treatment via MCMC. This avoids overfitting, and gives you information about how strongly your data specifies the model.
Welch Labs has a great 15-part series, where they gradually build up a decision tree model that counts the number of fingers in an image. Part 9 in the series explains the bias-variance spectrum really well: https://youtu.be/yLwZEuybaqE?list=PLiaHhY2iBX9ihLasvE8BKnS2X...
And this is not unique to machine learning, per se. https://fivethirtyeight.com/features/trump-noncitizen-voters... has a great widget that shows that as you get more data, you do not necessarily decrease inherent noise. In fact, it stays very constant. (Granted, this is in large because machine learning has most of its roots in statistics.)
More explicitly, with ML, you are building probabilistic models. This is contrasted to most models folks are used to which are analytic models. That is, you run the calculations for an object moving across the field, and you get something within the measurement bounds that you expected. With a probabilistic model, you get something that is within the bounds of being in line with previous data you have collected.
(None of this is to say this is a bad article. Just a bias to keep in mind as you are reading it. Hopefully, it helps you challenge it.)