K-means is based on some quite wild assumptions - your data follows a specific case of the Gaussian distribution. Plus side is that the algorithm is relatively easy to understand and implement so it is a good starting point into clustering.
When you got this, then next step is probably to consider if the centroid is really a good representation of the distribution of your data. If you still believe that your data is about to follow some form of Gaussian distribution then K-means can be levelled up with the EM algorithm.
More over, if you are faced with some crazy multidimensional data then it may be fair first try to reduce the dimensionality of the data with the PCA or t-SNE algorithm or with combination of both. Or perhaps use autoencoders.
> K-means is based on some quite wild assumptions - your data follows a specific case of the Gaussian distribution. Plus side is that the algorithm is relatively easy to understand and implement so it is a good starting point into clustering.
K-means is a non-parametric clustering algorithm, which assumes no underlying properties about your data. It is hard to evaluate the quality of a clustering algorithm without some clearly defined objective. In particular, k-mean's cousin in the classification community, k-nearest neighbors, actually is provably a a Bayes optimal decision strategy as k and the number of samples increases, regardless of the underlying distribution of your data (i.e., it is strongly consistent, see [0]).
> K-means can be levelled up with the EM algorithm
In fact, the k-means algorithm is actually a special case of fitting a mixture of k Gaussian distributions where all the Gaussians are isotropic (have identical covariance matrices with uniform elements on the diagonal, i.e. a scaled identity matrix).
What is it about k-means that means it doesn't work on other distributions?
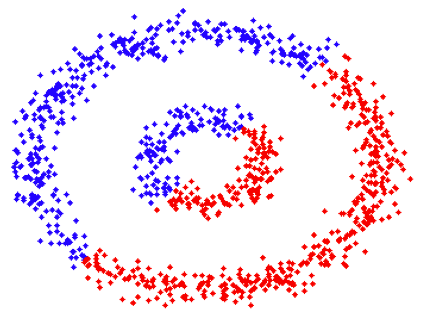
I find it easy to come up with other (contrived) distributions where K-means produces the results that a human would produce. E.g. disjoint (and distant) circles, each containing uniform random distribution of points.
A lot of online engagement data looks like a power law distribution on large platforms. The mean (obviously) has huge variance. Say you have multiple metrics per user like this. You can still apply k-means but the huge variance makes it rather ineffective. That's what I've found, anyway.
That is a lot of text for such a simple algorithm, the regular implementation:
1. K observations are chosen randomly from the dataset as initial means.
2. K clusters are created by associating every observation with its nearest mean.
3. The centroid of each of the K clusters becomes the new mean.
Steps 2 and 3 are repeated until we reach convergence. Very simple cases are badly clustered with this algorithm: https://cdn-images-1.medium.com/max/1200/1*BGSo8t0ktVLDn4Chv... (an example with K=2). However, it is the simplest clustering algorithm thus a good start for people who want to start learning about this field!
I wrote a JS implementation and tutorial on k-means a few years back [1], if anyone is looking for this in the browser. Great writeup, I appreciate the math focus!
In my experiments K-Means clustering proved to be super useful to detect malicious activities, cyberattacks and all kind of suspicious behaviors without knowing any rules or patterns in advance.
Here's how K-Means with K=20 detected malicious activity within real world, live web server - just by selecting smallest clusters (bottom table shows specifics about what fallen into smallest clusters - all hits but the first one are attempt to exploit web application by some nefarious actors):
If you find this interesting, you may also enjoy my introduction to k-means clustering, in which I implement Lloyd's algorithm and use it to classify handwritten digits:
In a previous life I've implemented news clustering algorithms for a couple of companies.
I wasn't impressed with the results with k-means and I've always found that agglomerative clustering algorithms to work better for natural text documents.
When you got this, then next step is probably to consider if the centroid is really a good representation of the distribution of your data. If you still believe that your data is about to follow some form of Gaussian distribution then K-means can be levelled up with the EM algorithm.
More over, if you are faced with some crazy multidimensional data then it may be fair first try to reduce the dimensionality of the data with the PCA or t-SNE algorithm or with combination of both. Or perhaps use autoencoders.